AccountTECH Blog
why Cloud now: notifications and campaigns
overview of the darwin.Cloud notifications and campaigns feature
why Cloud now: agent bill pay
overview of the darwin.Cloud agent bill pay
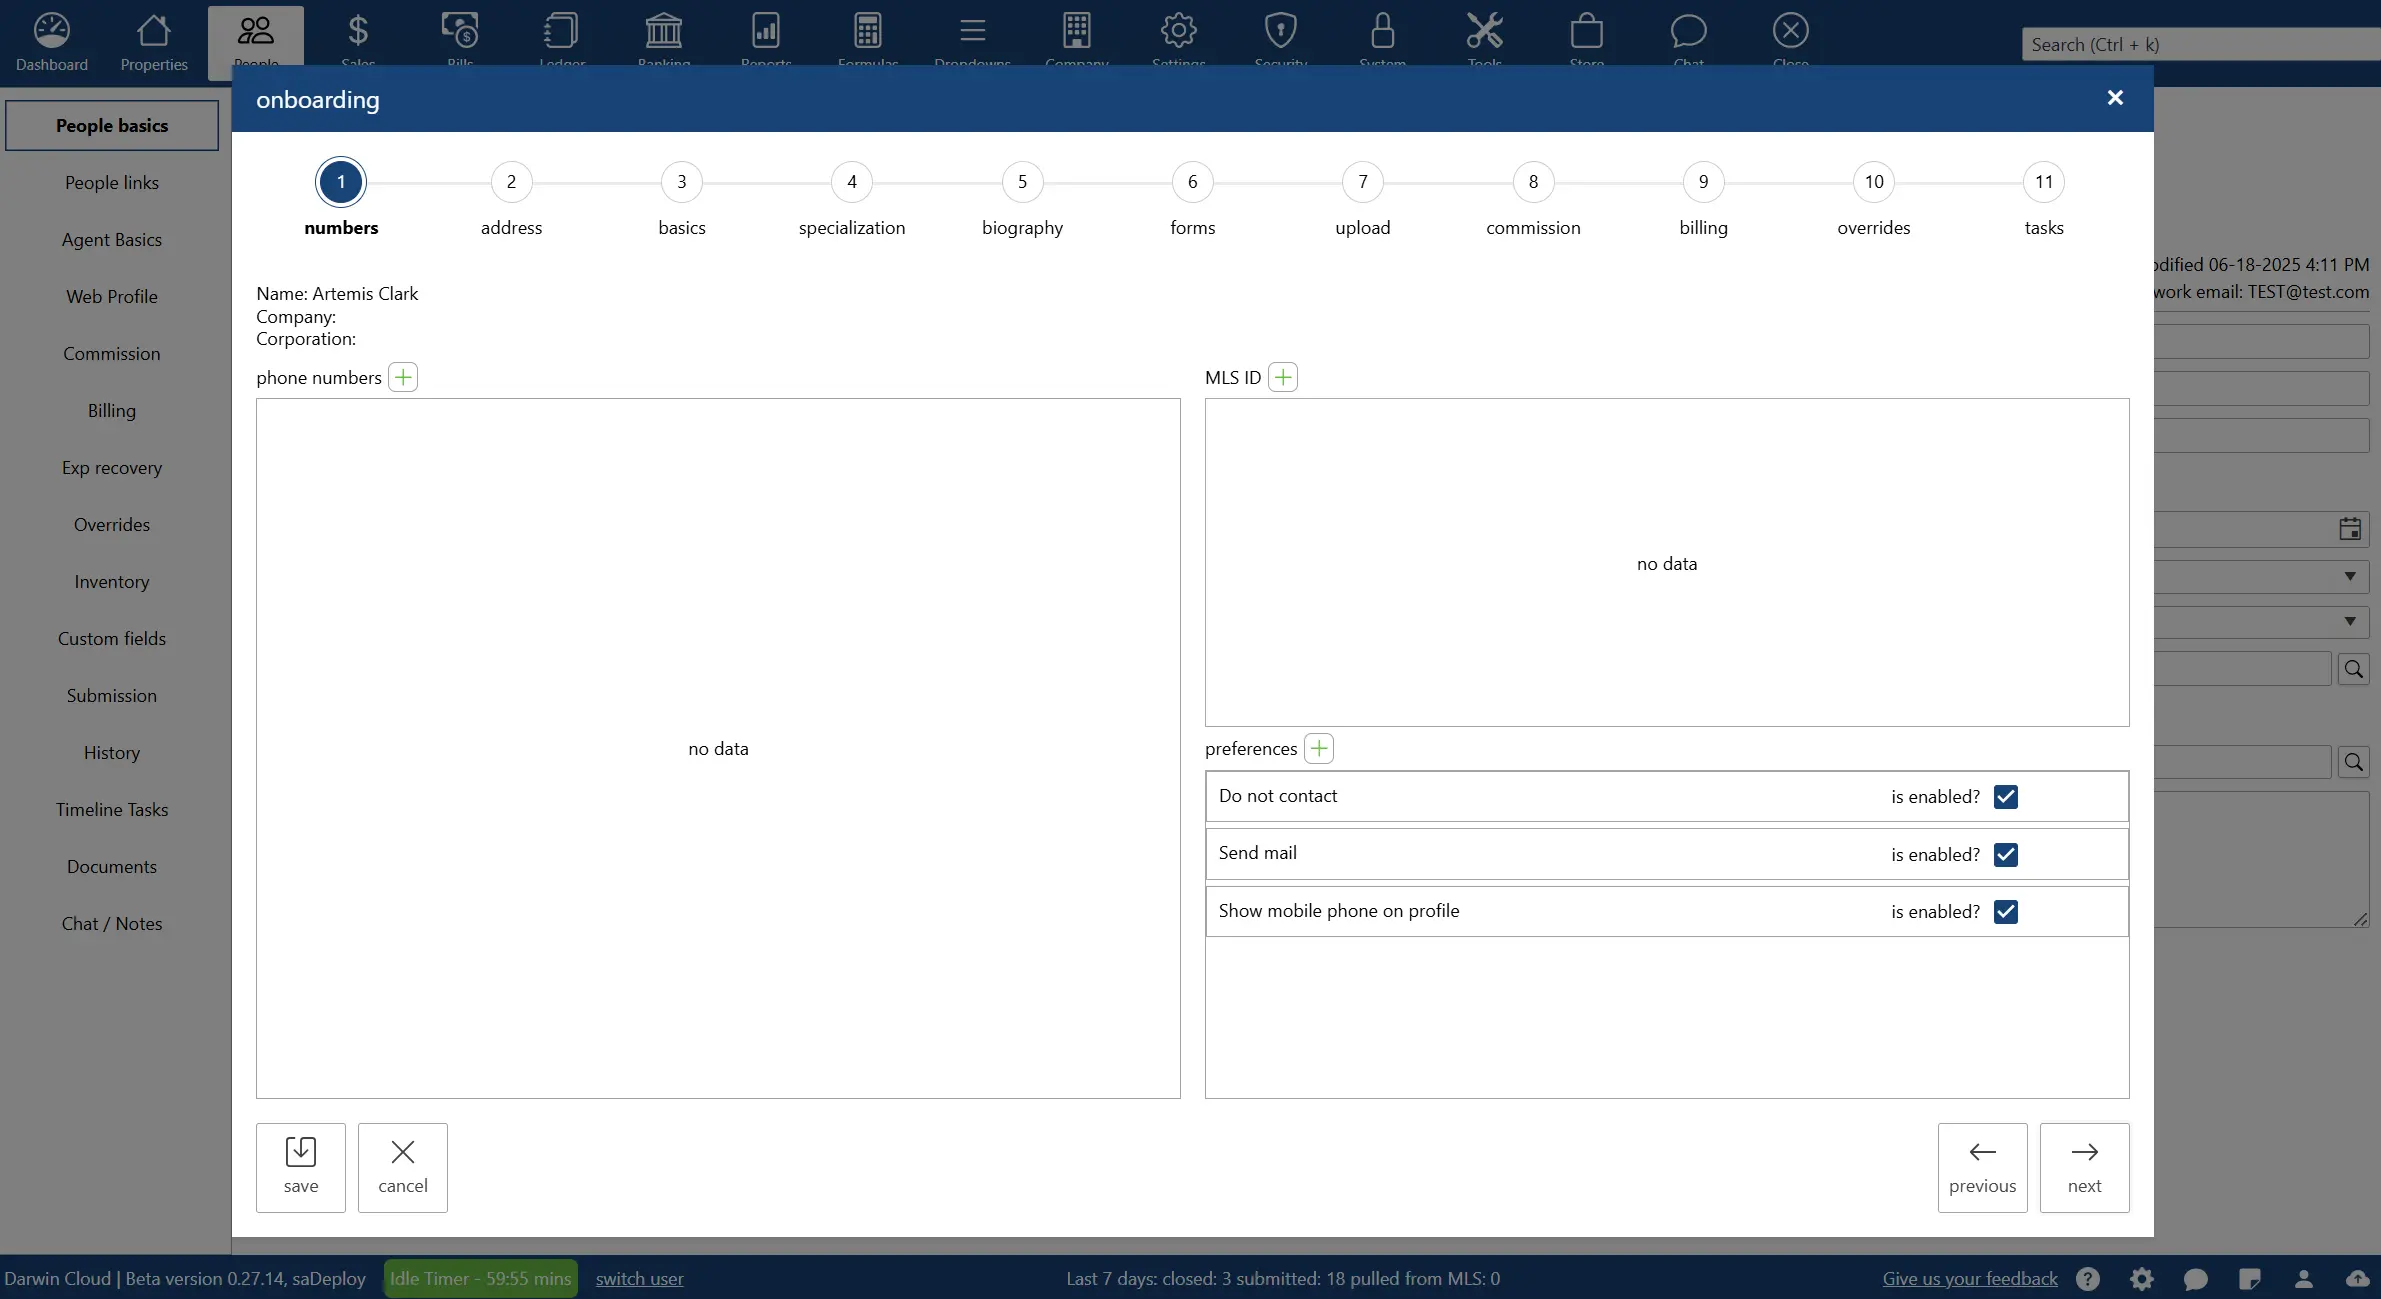
why Cloud now: agent on-boarding wizard
overview of the darwin.Cloud agent on-boarding wizard
why Cloud now: office forms library
overview of the darwin.Cloud office forms library features
why Cloud now: chat and notes
overview of the darwin.Cloud chat and notes features.
why Cloud now: document storage
overview of the darwin.Cloud document storage features.
why Cloud now: agent billing
overview of the darwin.Cloud agent billing features.
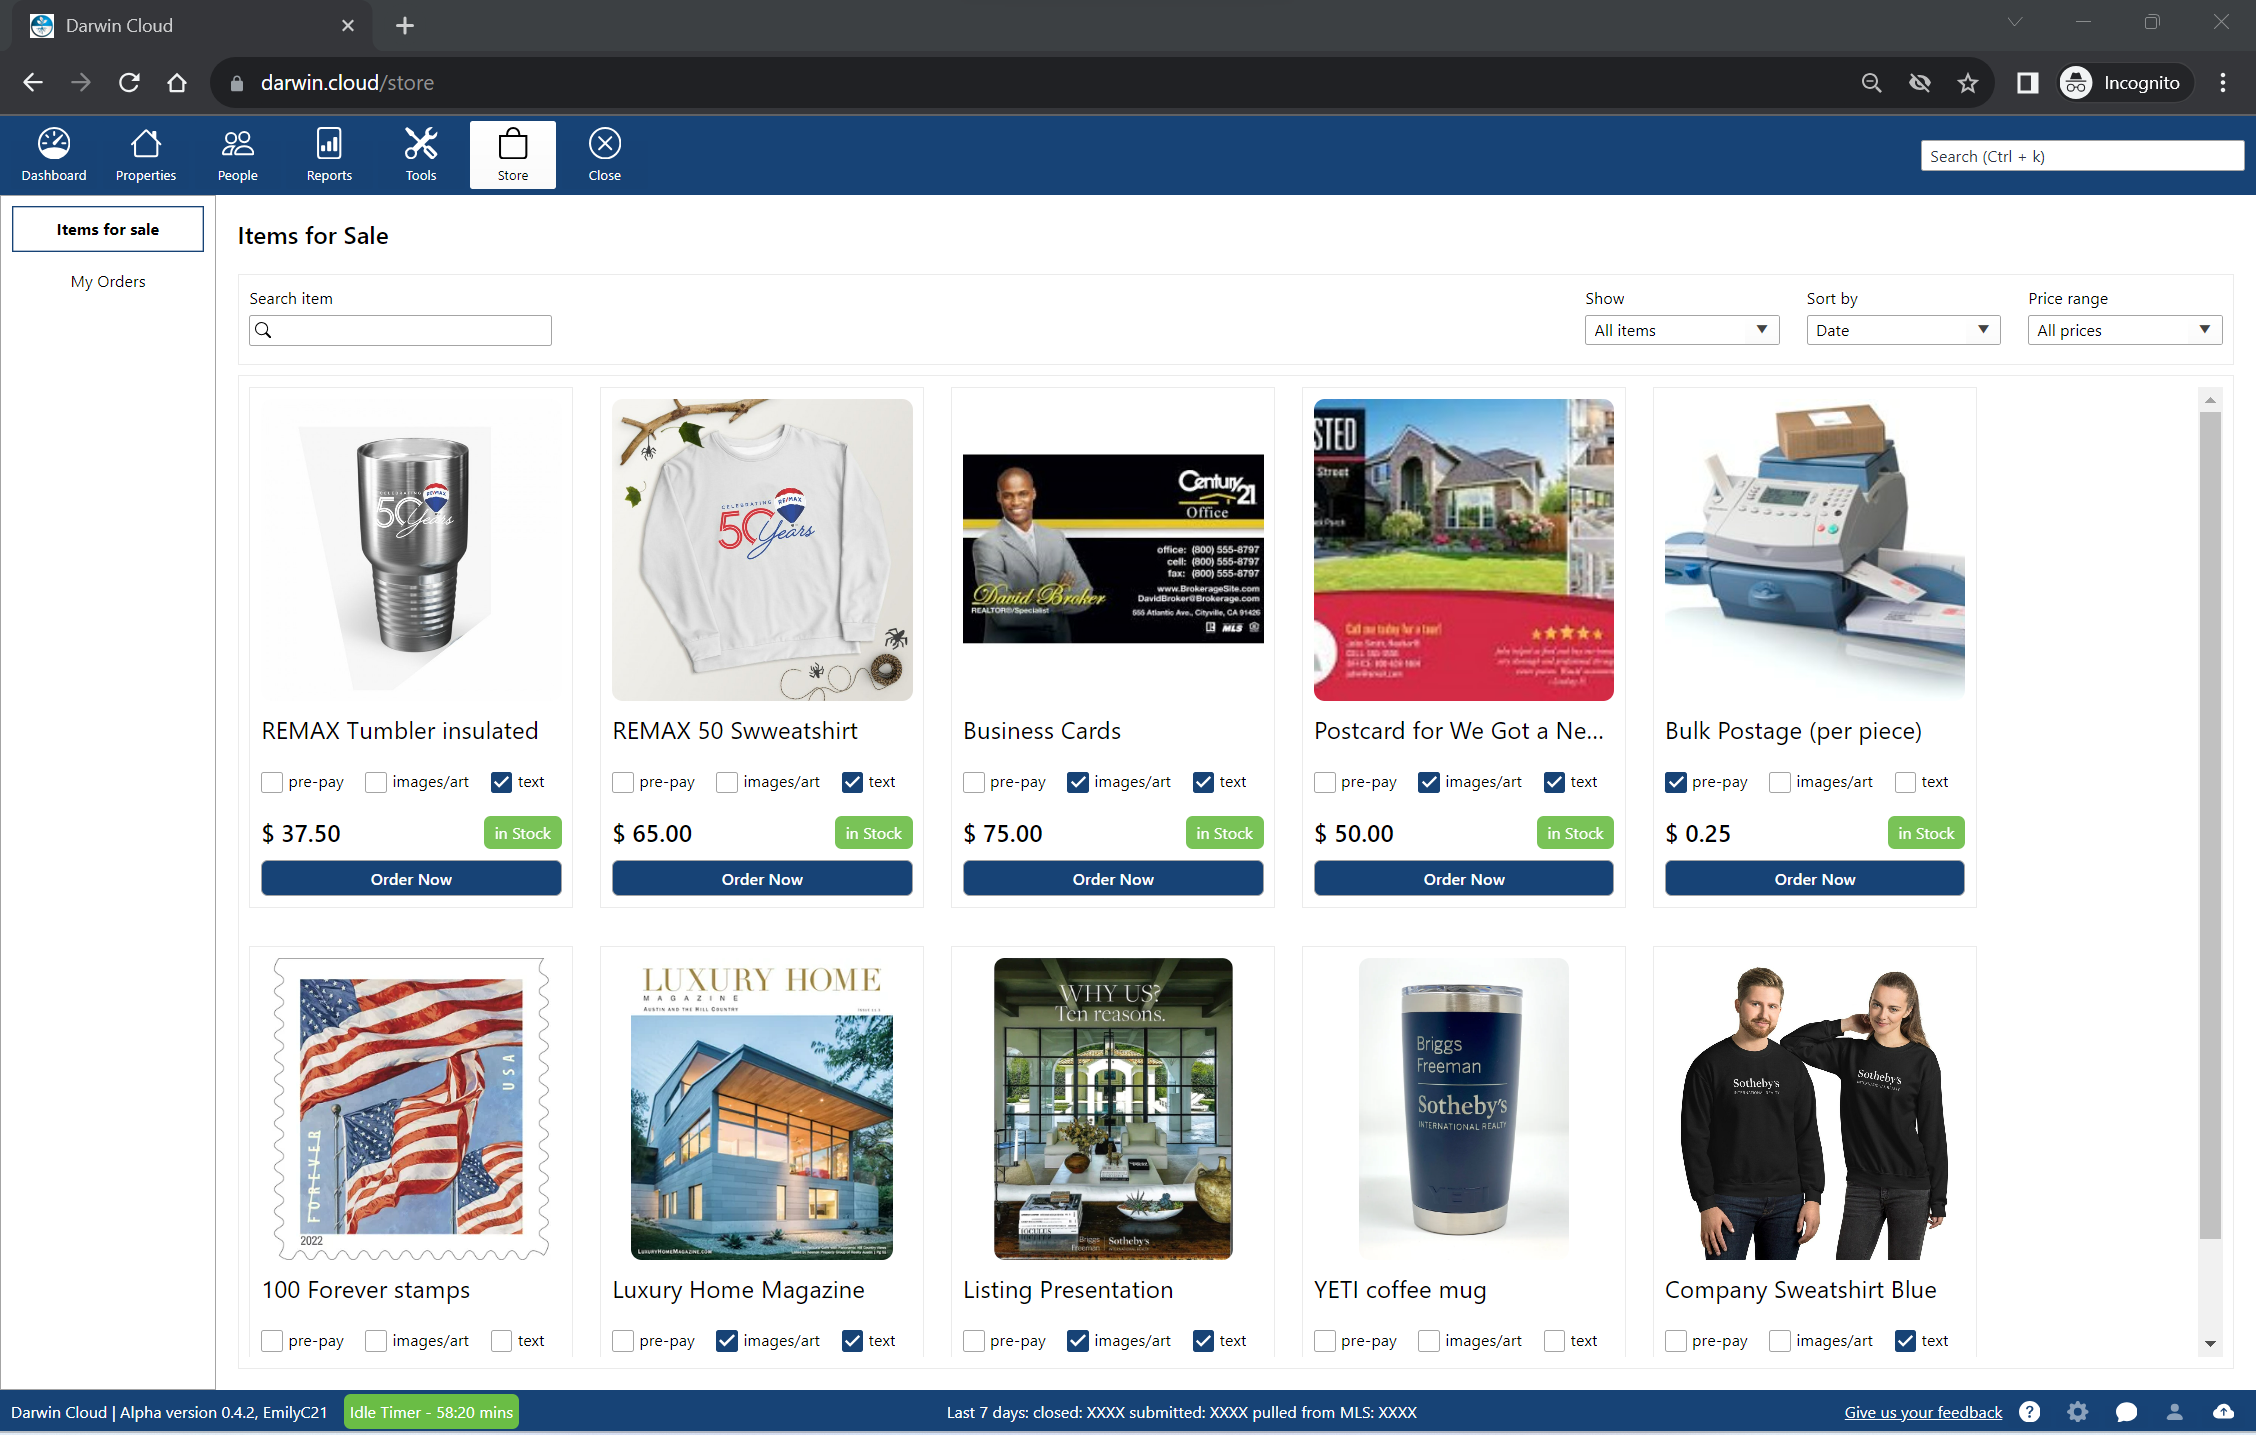
why Cloud now: company store
overview of the darwin.Cloud company store.
why Cloud now: agent portal
overview of the darwin.Cloud agent portal.
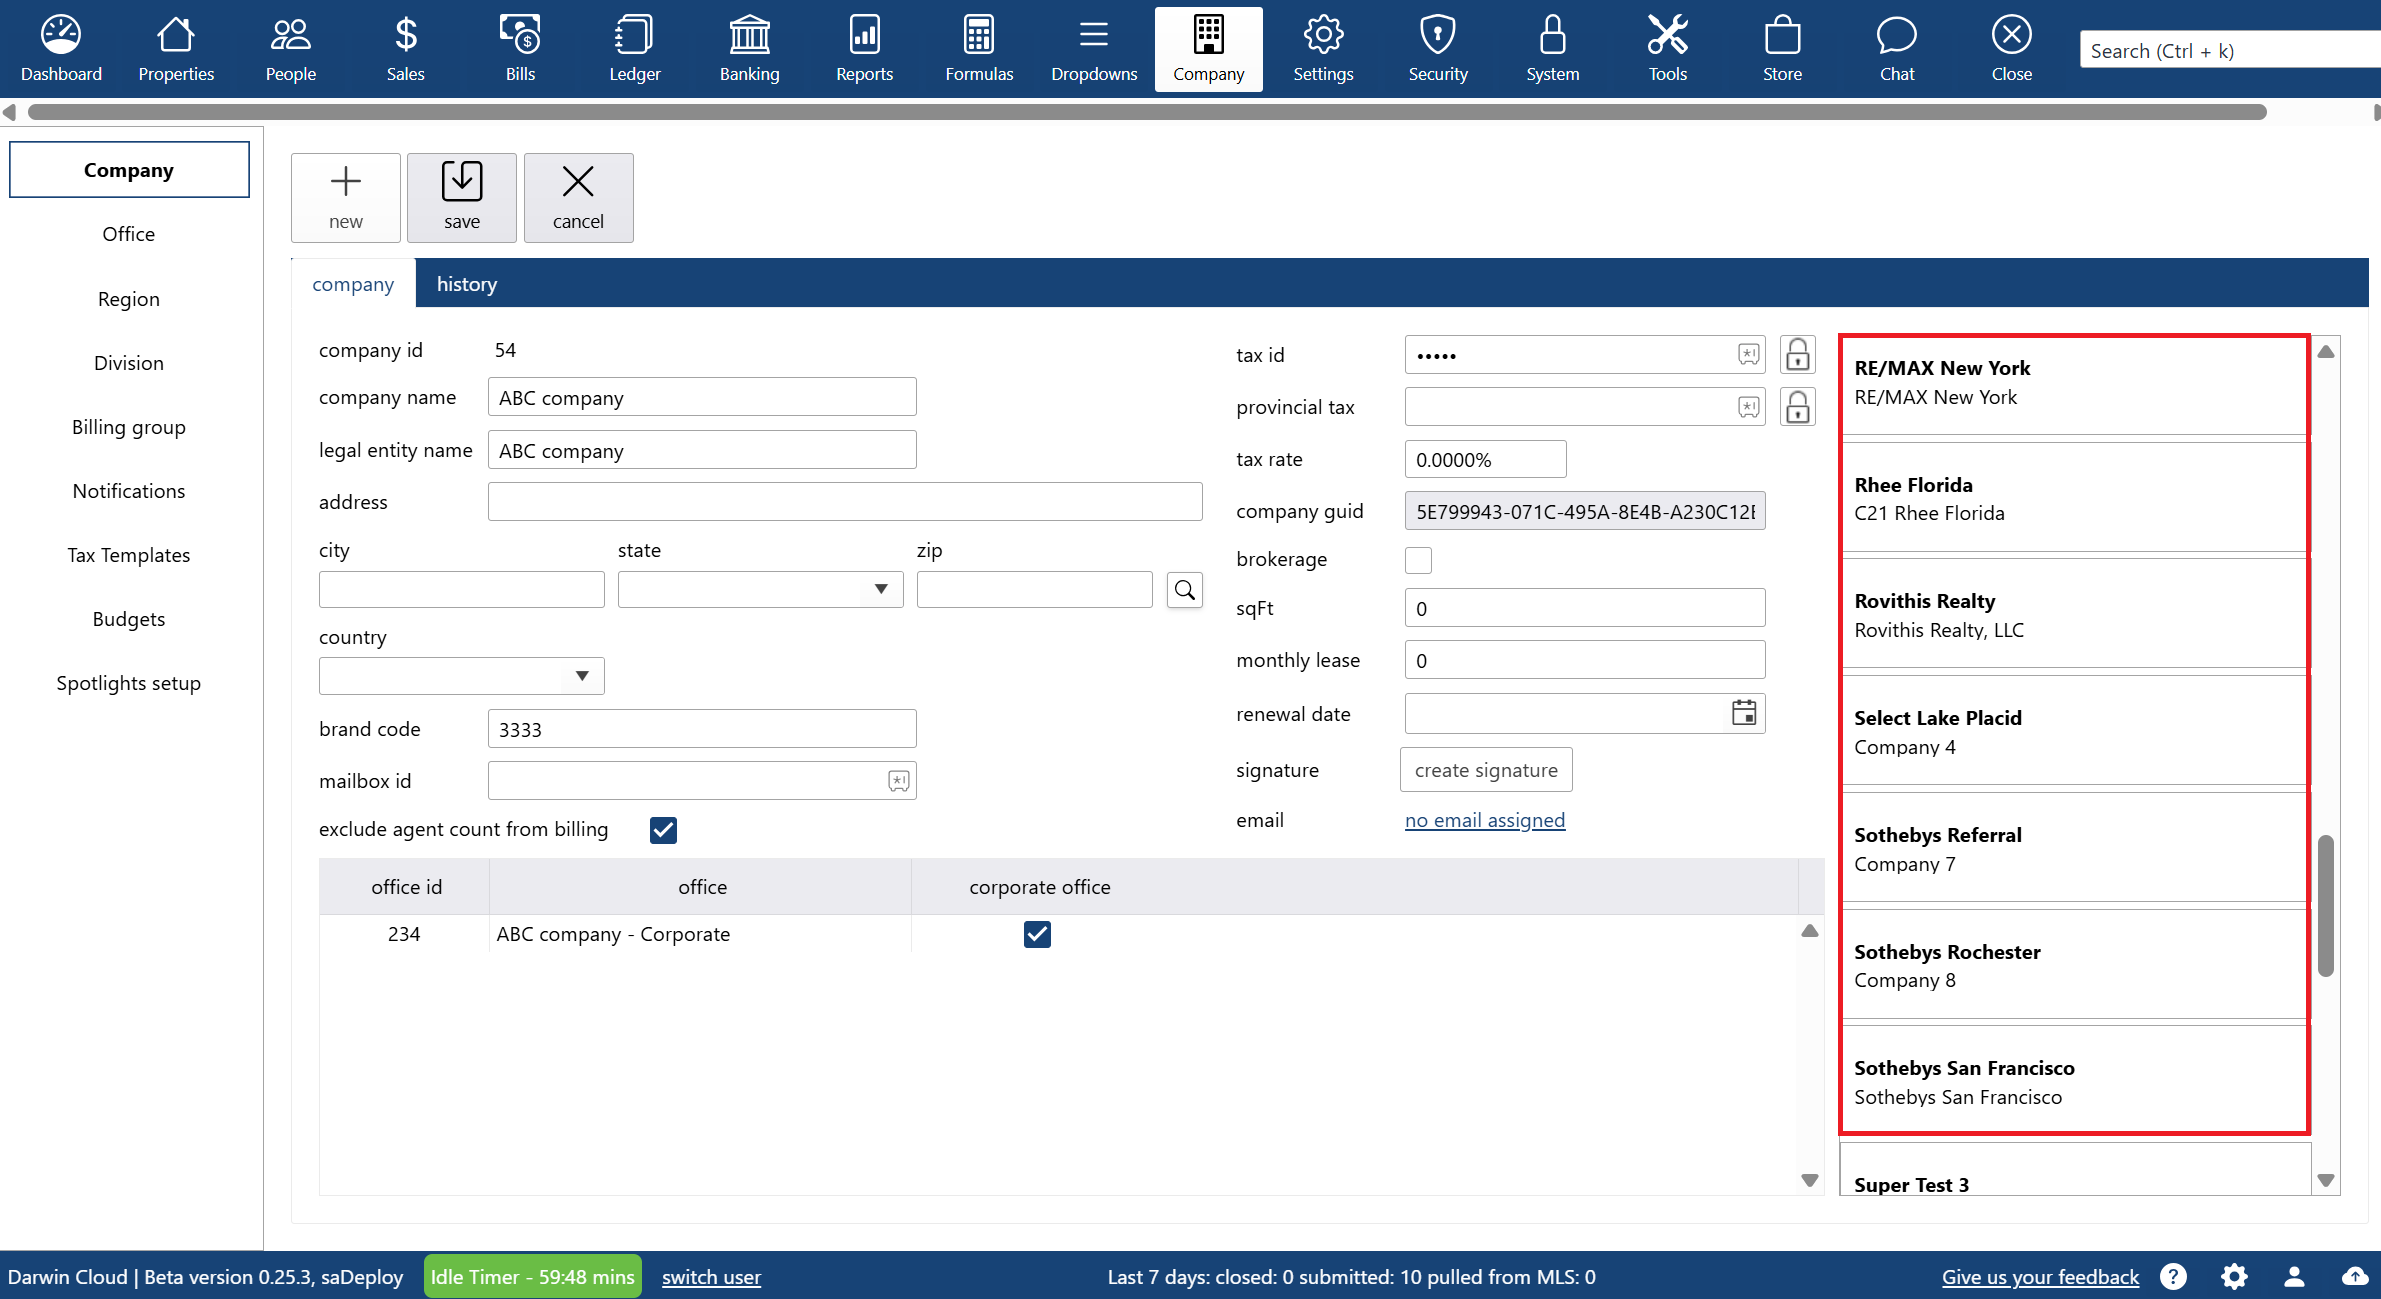
why Cloud now: multiple legal entities in ONE system
overview of multi-tenant accounting capabilities in the darwin.Cloud software for real estate and related businesses.
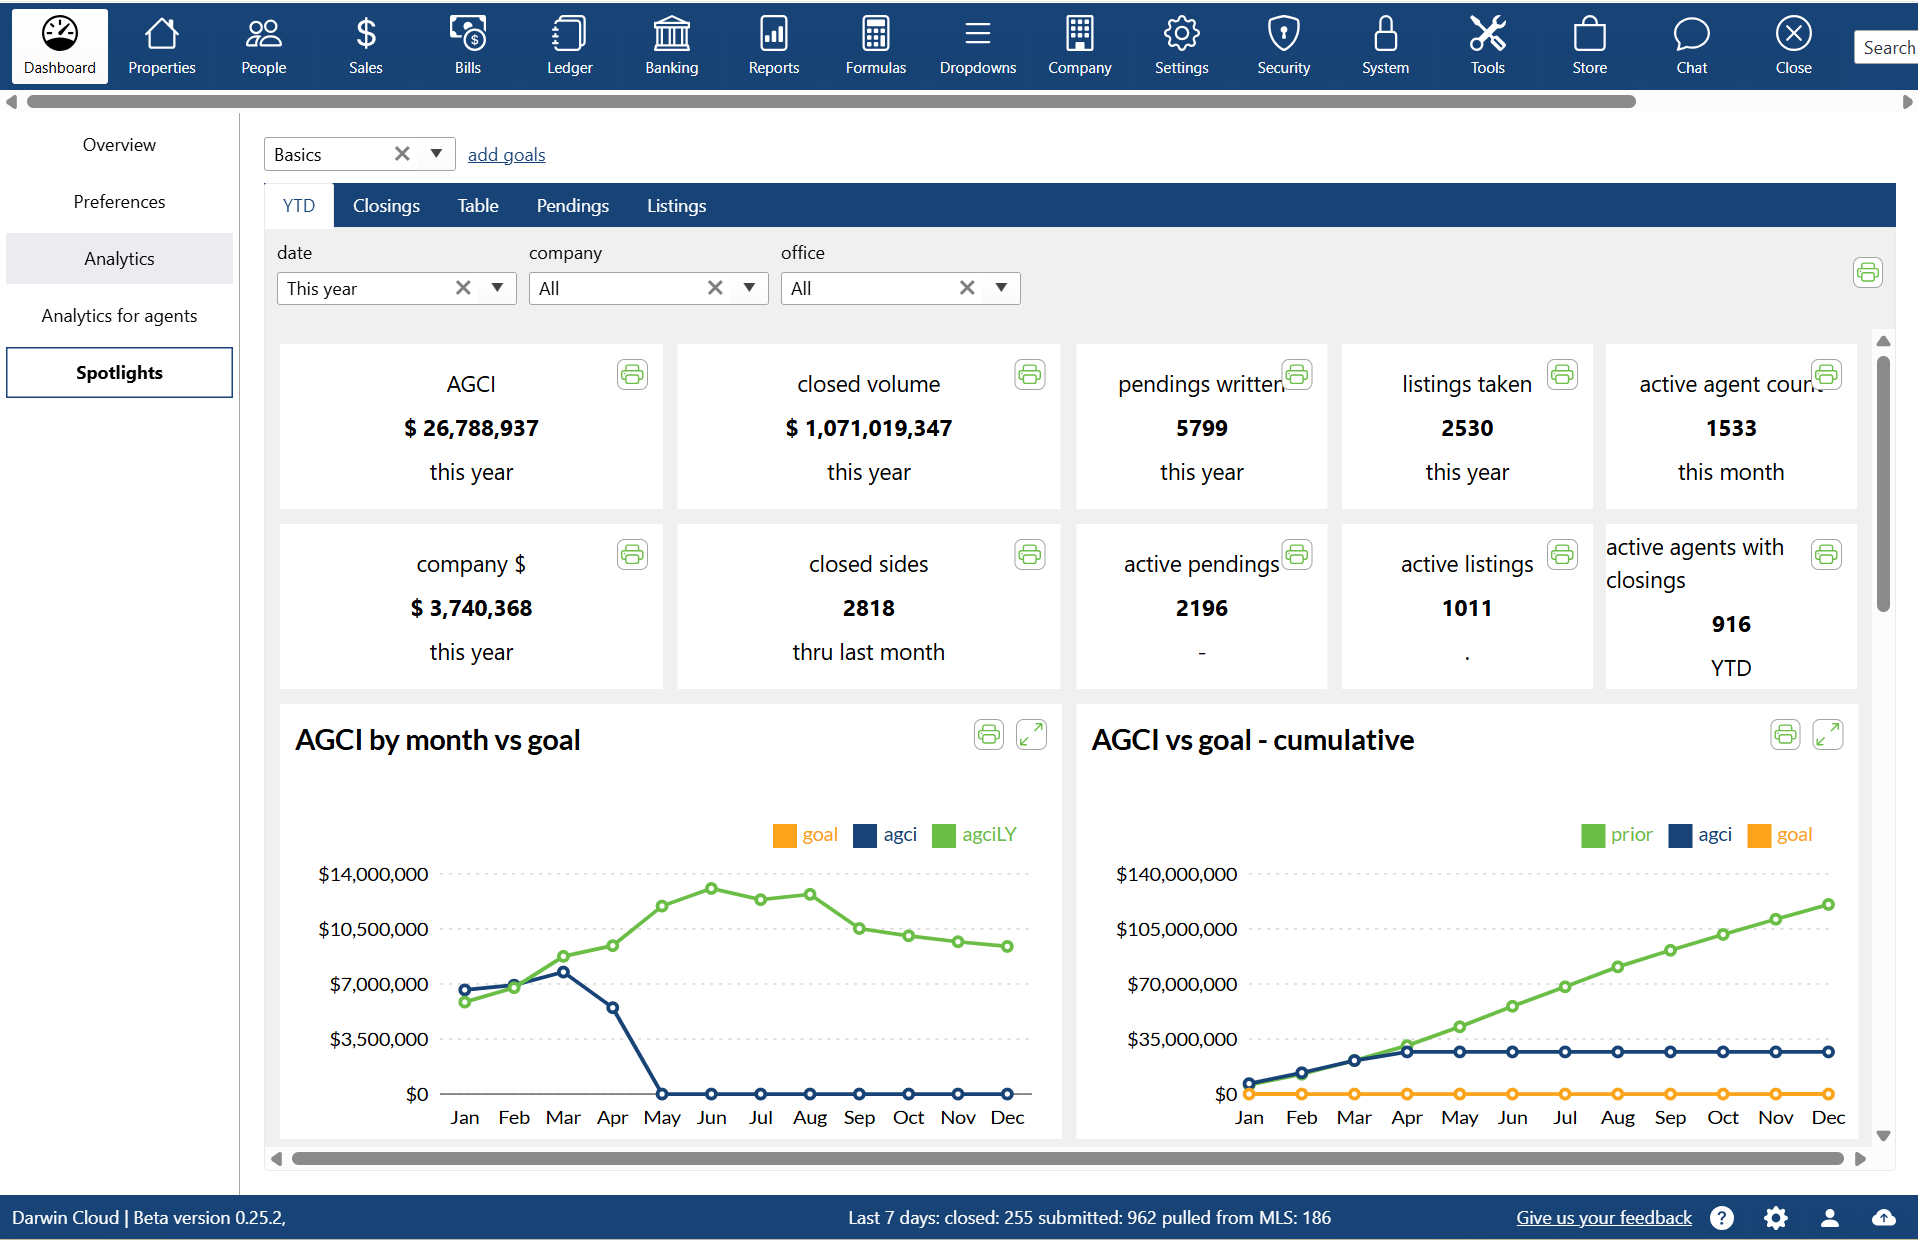
why Cloud now: spotlights
overview of darwin.Cloud's spotlights feature, including types of spotlights, customization options, and use cases.
why Cloud now: multi company
a look behind the scenes at the decisions, thinking & timing behind the next version of darwin software: darwin.Cloud. this video focuses on the ability to have all the different companies that you own running in darwin at the same time. one login. one system. all your companies.
why Cloud now: integrations with other software
a look behind the scenes at the decisions, thinking & timing behind the next version of darwin sofwtare: darwin.Cloud. this video focuses on integrating darwin.Cloud with other software programs by importing their data into darwin.

Behind the scenes: the story behind darwin.Cloud
while working together to finish darwin.Cloud, Mark Blagden, CEO of AccountTECH and Helkyn Coello, VP of Development recorded a series on conversations about the design & building of darwin.Cloud. this is their conversation about the long road to building darwin.Cloud.
why Cloud now: company store sell and bill
a look behind the scenes at the programming behind darwin.Cloud. this hackathon project lets you keep track of everything you sell to agents. agents can buy from you online - and the invoicing and collections is automatic.

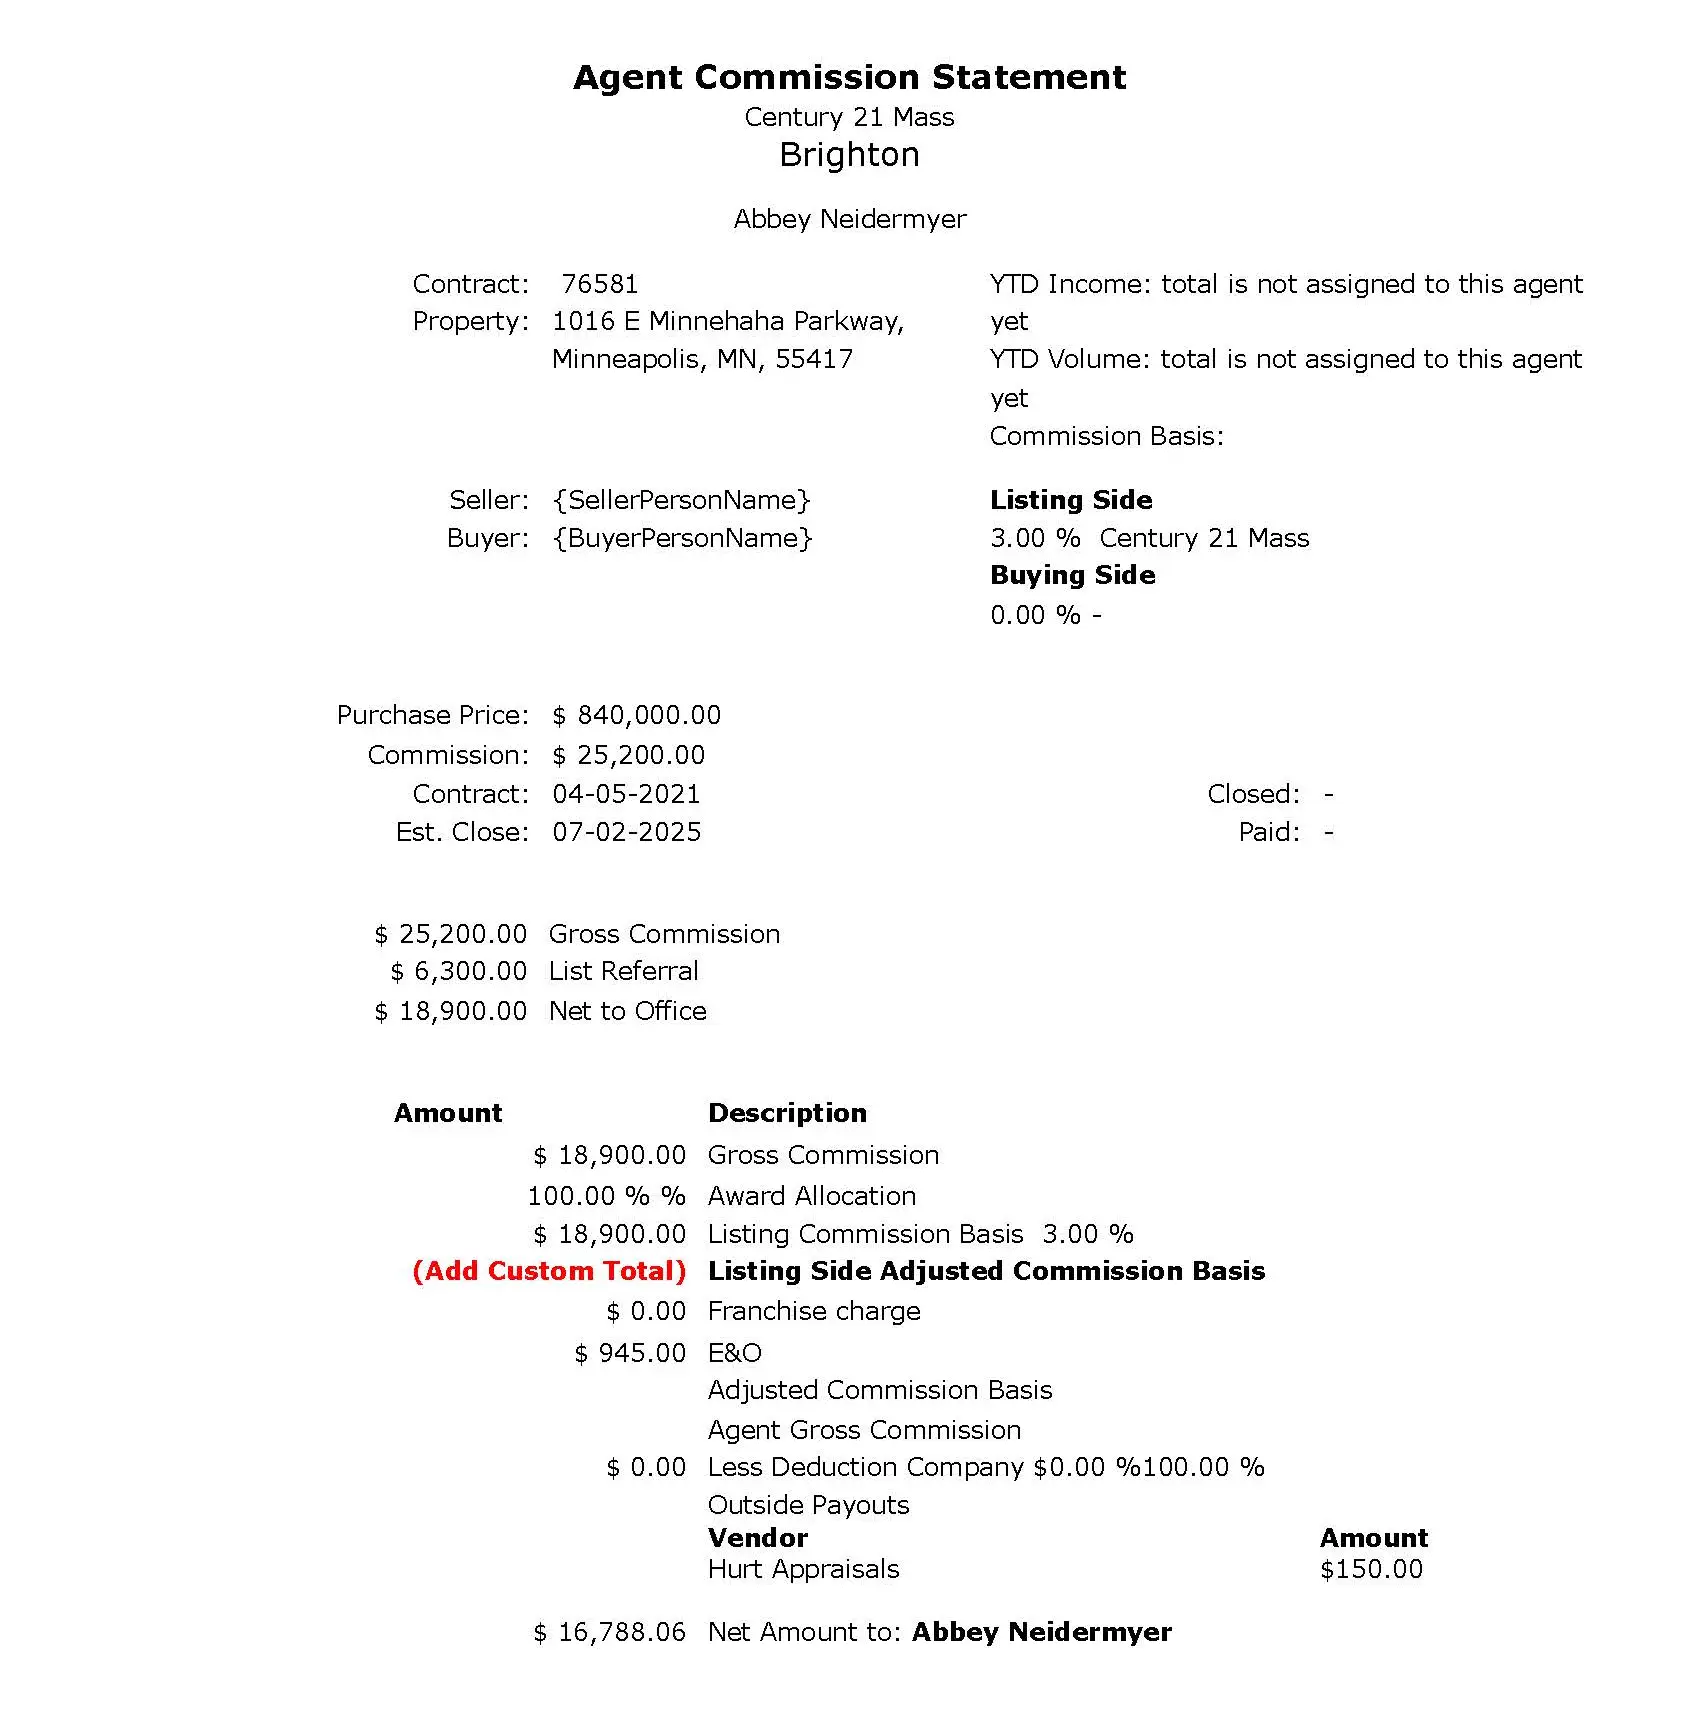
You’re Not Losing Agents—You’re Just Paying Them Wrong
Manual commission workflows hurt retention. See how automation drives ROI, reduces errors, and keeps agents from walking out the door.

Growth Will Break Your Real Estate Brokerage—Unless You Fix These 4 Things First
Scaling brings complexity. Learn how AccountTECH helps real estate brokerages eliminate payout errors, reduce risk, and lead with visibility.

Finding the Perfect Real Estate Accounting Software in 2025
Real estate accounting software built to automate commissions, ensure compliance, and provide real-time insights to help your brokerage grow.

Protect Your Data with Real Estate Software Security Solutions
Discover how to protect your brokerage with real estate software security best practices. Learn about AccountTECH’s advanced tools to safeguard sensitive data and ensure compliance.
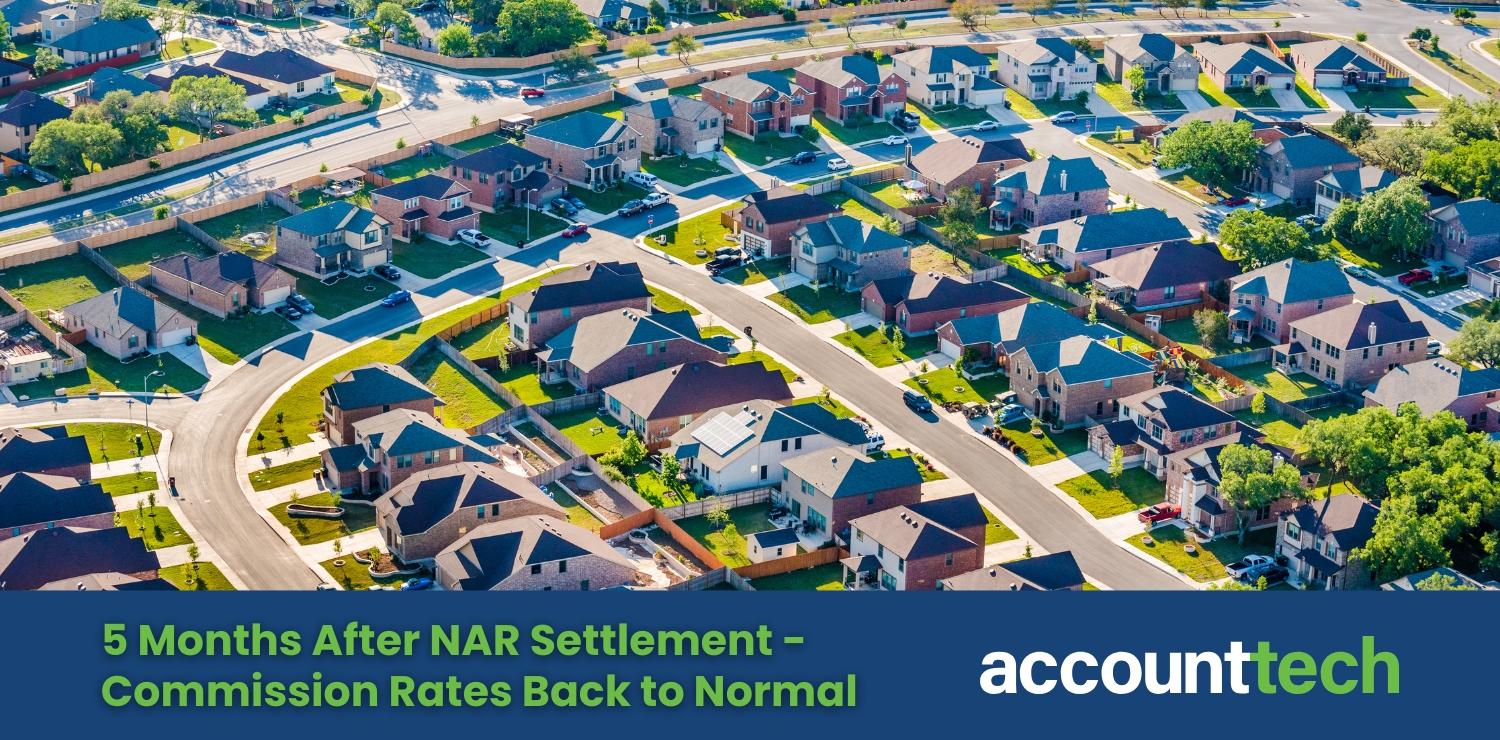
5 Months After NAR Settlement - Commission Rates Back to Normal
AccountTECH study finds real estate commission rates recovering by the 5th month post-NAR Settlement, with seller rates slightly increasing.

AccountTECH Company Dollar Study: Are Top Producing Agents Really Worth it?
Discover how top-decile agents drive higher company dollar retention for brokerages, with insights from AccountTECH's latest study on agent performance.
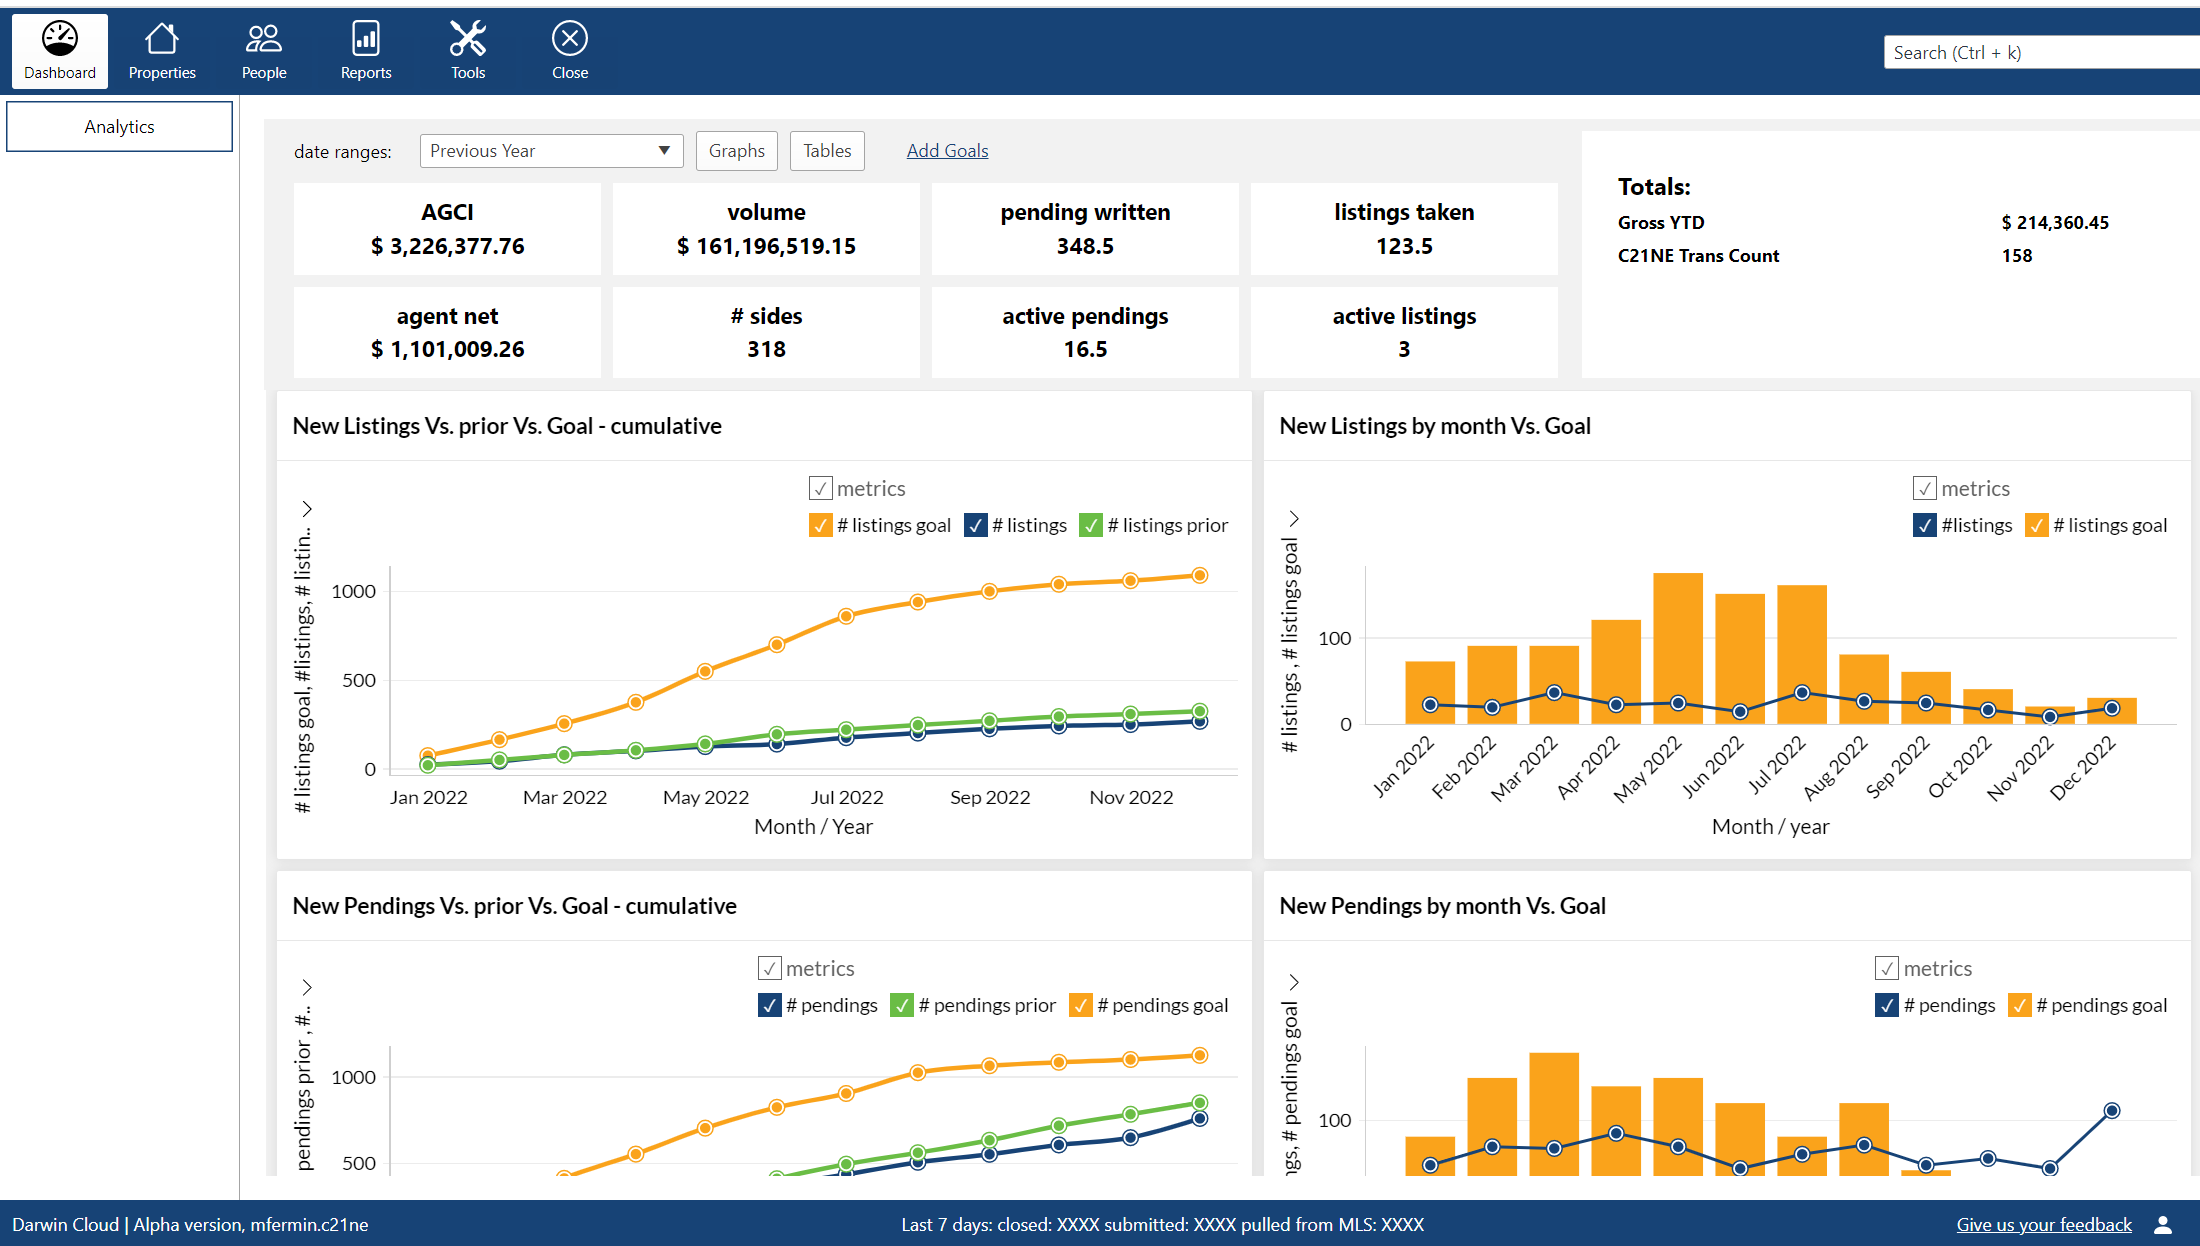
Real Estate Reporting Tools Empower Data-Driven Decisions
Unlock smarter decisions with AccountTECH’s darwin platform. Learn how real estate reporting tools transform data into actionable insights, streamline workflows, and drive success.
Mastering Multi-Tier Commission Structures with Automation
Master multi-tier commissions with AccountTECH’s darwin platform. Automate calculations, ensure compliance, and boost agent satisfaction.
Enhancing Brokerage Efficiency with MLS and CRM Integration
Streamline your real estate operations with AccountTECH’s MLS and CRM integration tools. Discover how darwin improves efficiency, enhances collaboration, and boosts client service.

Master Real Estate Commission Payouts with AccountTECH
Simplify commission payouts and compliance with AccountTECH’s automated software. Boost accuracy, save time, and strengthen agent trust.
5 Ways Real Estate Back Office Software Boosts Holiday Workflows
Discover how real estate back office software streamlines holiday workflows with automation, MLS and CRM integrations, and year-round compliance tools.

Real Estate CRMs Strengthen Client Relationships and Drive Sales
Explore how real estate CRMs strengthen client relationships, automate follow-ups, and drive sales for brokerages focused on growth.
AccountTECH study finds average sized Real Estate brokerages have PPP that is 10 times higher than the largest companies
AccountTECH announces the release of its latest white paper: Production Per Person (PPP) Analysis of Agent by Quartiles: Insights into Efficiency and Agent Roster Composition.

How Real Estate Back Office Software Streamlines Brokerage Operations
Discover how real estate back-office software like darwin streamlines operations, automates commissions, ensures compliance, and supports growth.
AccountTECH announces Top 10 companies for Gross commission per agent - 3rd Qtr 2024
AccountTECH's latest analysis reveals the top 10 U.S. real estate companies with the highest AGCI per agent in 2024, highlighting traits of high-performer brokerages.
AccountTECH report finds little change in commission rate since NAR settlement
AccountTECH’s study on the NAR Settlement’s impact finds minor changes to real estate commission rates but signals a drop in buyer-side transactions.

5 Benefits of Using Real Estate Accounting Software
Discover 5 key benefits of using AccountTECH’s real estate specific accounting software to streamline finances, enhance accuracy, and support growth.

Essential Software Solutions for Real Estate Brokerages
From tracking commissions to nurturing client relationships, the right real estate software can streamline essential tasks and empower brokerages to work more efficiently.
Mark Blagden from AccountTECH talks about the features in Project Management software Shaker.io
AccountTECH CEO Mark Blagden announces the Shaker.io acquisition, sharing why its design and project management tools are a valuable addition to darwin.Cloud.
Shaker.io CEO Chris Lucas talks about the key features in Shaker for relationship and workflow management
Shaker.io CEO Chris Lucas highlights Shaker’s key features for managing relationships and workflows, enhancing real estate transaction efficiency and client engagement.
AccountTECH acquires Transaction Management Platform Shaker.io
AccountTECH acquires Shaker.io, enhancing real estate client value with advanced transaction management, automation, and seamless communication tools.

Outsource Labor Cost prices for Real Estate brokerages
AccountTECH conducted a nationwide survey of prices for outsourced accounting services for Real Estate brokerages. Here is what they found.

Real Estate Brokerage Labor Cost Per Transaction Exceeds $900 thru mid-year 2024
AccountTECH has released a benchmark report detailing labor costs for the first six months of 2024. The analysis reveals that the average labor cost per transaction surpassed $900.
Creating the Real Estate vertical - a new approach
For over 20 years, the “holy-grail” in Real Estate software engineering has been the “all-in-one” real estate vertical. Sometimes referred to as an “operating system” for Real Estate, the idea is to build a single application that provides a software solution for every stage of the real estate sales process.

Profitability in an era of post-NAR declining commission percentages
A study this week of hundreds of brokerages across the US shows that virtually all will become unprofitable once the market changes from the NAR settlement go into effect. AccountTECH, a leading provider of enterprise-class accounting software for the Real Estate industry, has just released the results of a study that examines the impact on brokerage profitability if commission rates drop below 6%. (3% per side) in response to the NAR settlement.

Modest gains as more Real Estate brokerages turn Profitable by mid-year 2024
A new study reveals a slight improvement in the number of profitable brokerages in the first half of 2024 compared to the previous year.

Spotlight to stay on-track
darwin.Cloud - run your brokerage from your phone. With darwin mobile, you can manage cash, pay your bills, check your budgets and message with everyone ... all from your phone.
darwin.Cloud unveiled at T3 Leadership Summit
AccountTECH is moving online and upstream. AccountTECH, a trailblazing innovator of accounting software solutions for brokerages and franchisors , announces the launch of the industry's first and only cloud-based enterprise accounting software.

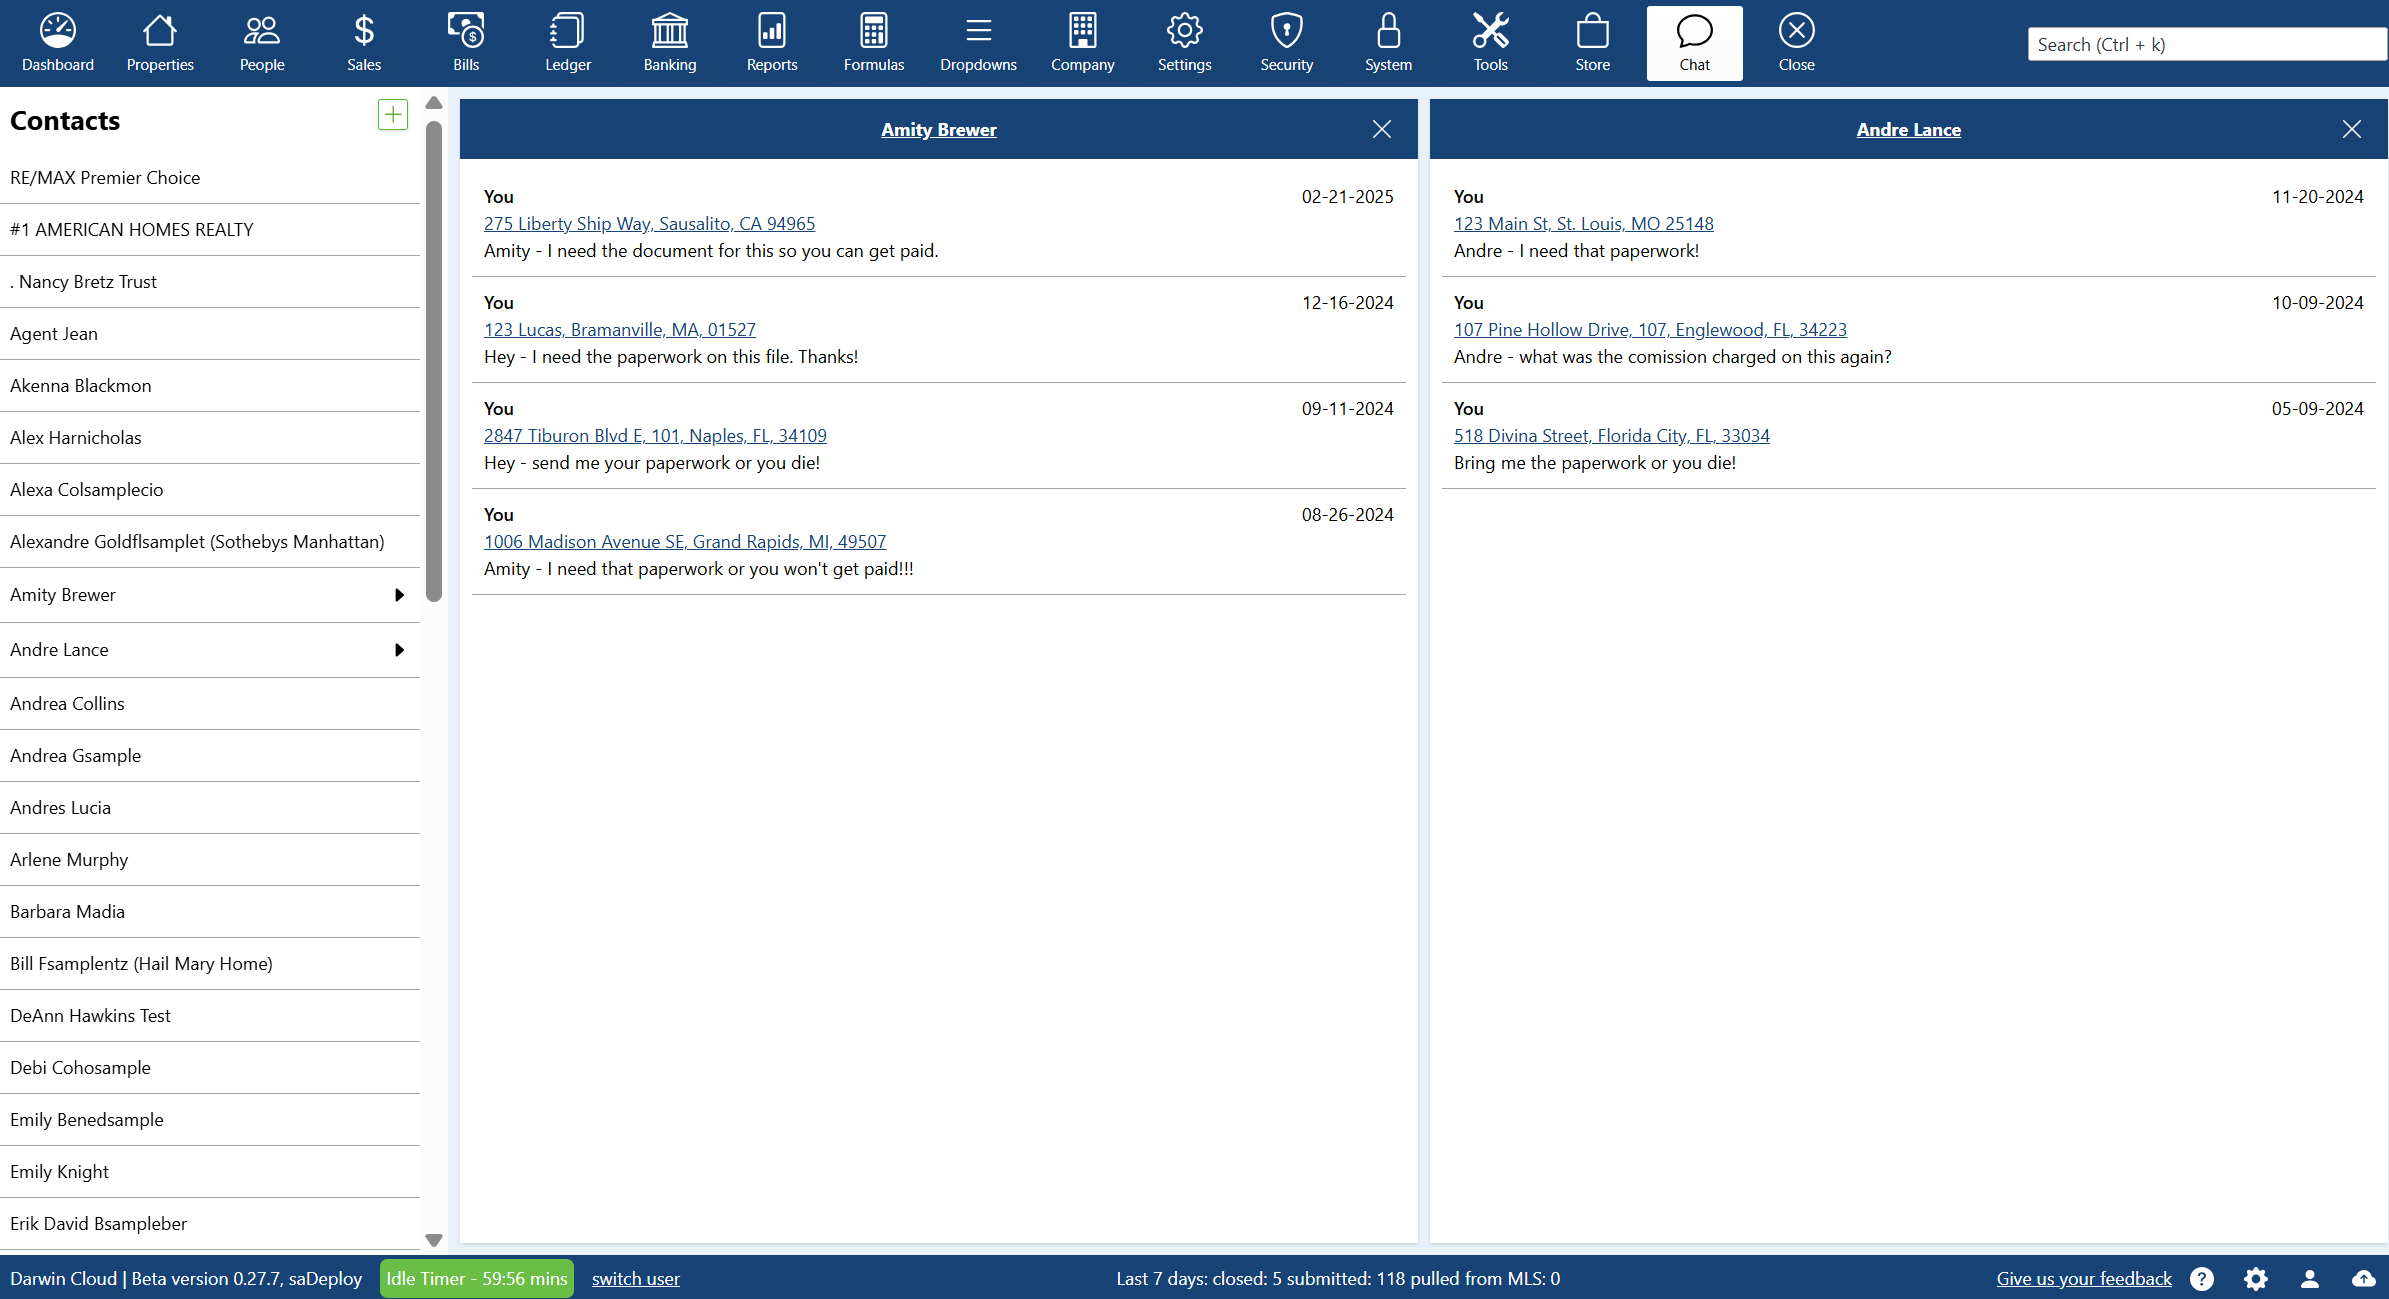
Introducing darwin.Chat
darwin.Chat is a breakthrough technology that lets users communicate via text message from inside darwin.Cloud

Spotlight: 1st 100 days
Spotlight new Recruits success towards getting paid in the 1st 100 days

Spotlight: Profit per Agent
Total Income per Agent numbers are helpful - but they're not the whole story. We need to see agent income compared to the overhead in the office where they work.
Spotlight Security: Setup unique Spotlights for each role in your company
Controlling Spotlight visibility. Spotlights allow you to set visibility of specific Spotlights to specific roles in your company.
Spotlight Analytics: Income vs Budget
KPI Spotlight: Income vs Budget. Spotlights are the newest and best way to see how your company is performing. Using a collection of key performance indicators, you can quickly see Income by month or cumulatively thru the year and how it compares to budget.
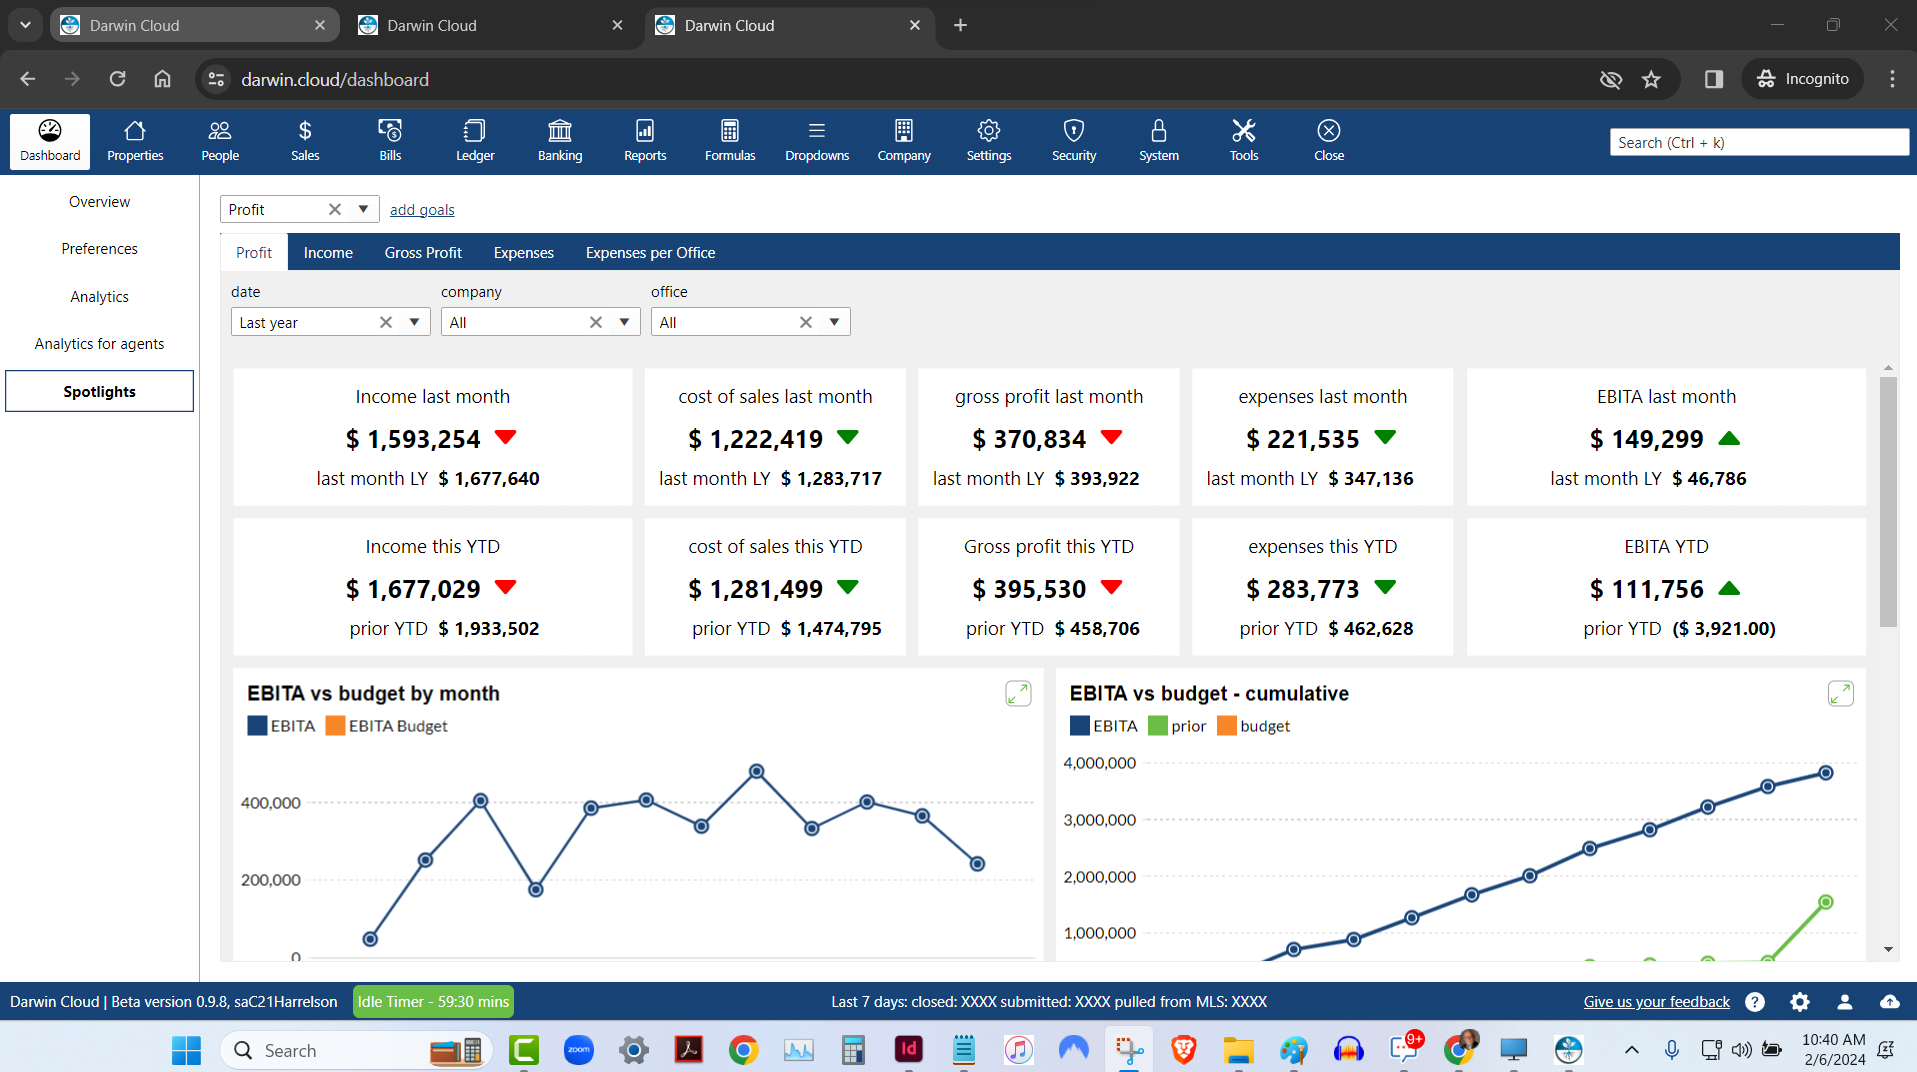
Spotlight Analytics: Profit & Loss
KPI Spotlight: Profit & Loss. Spotlights are the newest and best way to see how your company is performing. Using a collection of key performance indicators, you can quickly see Profit for last month and Year to date compared to the prior year.
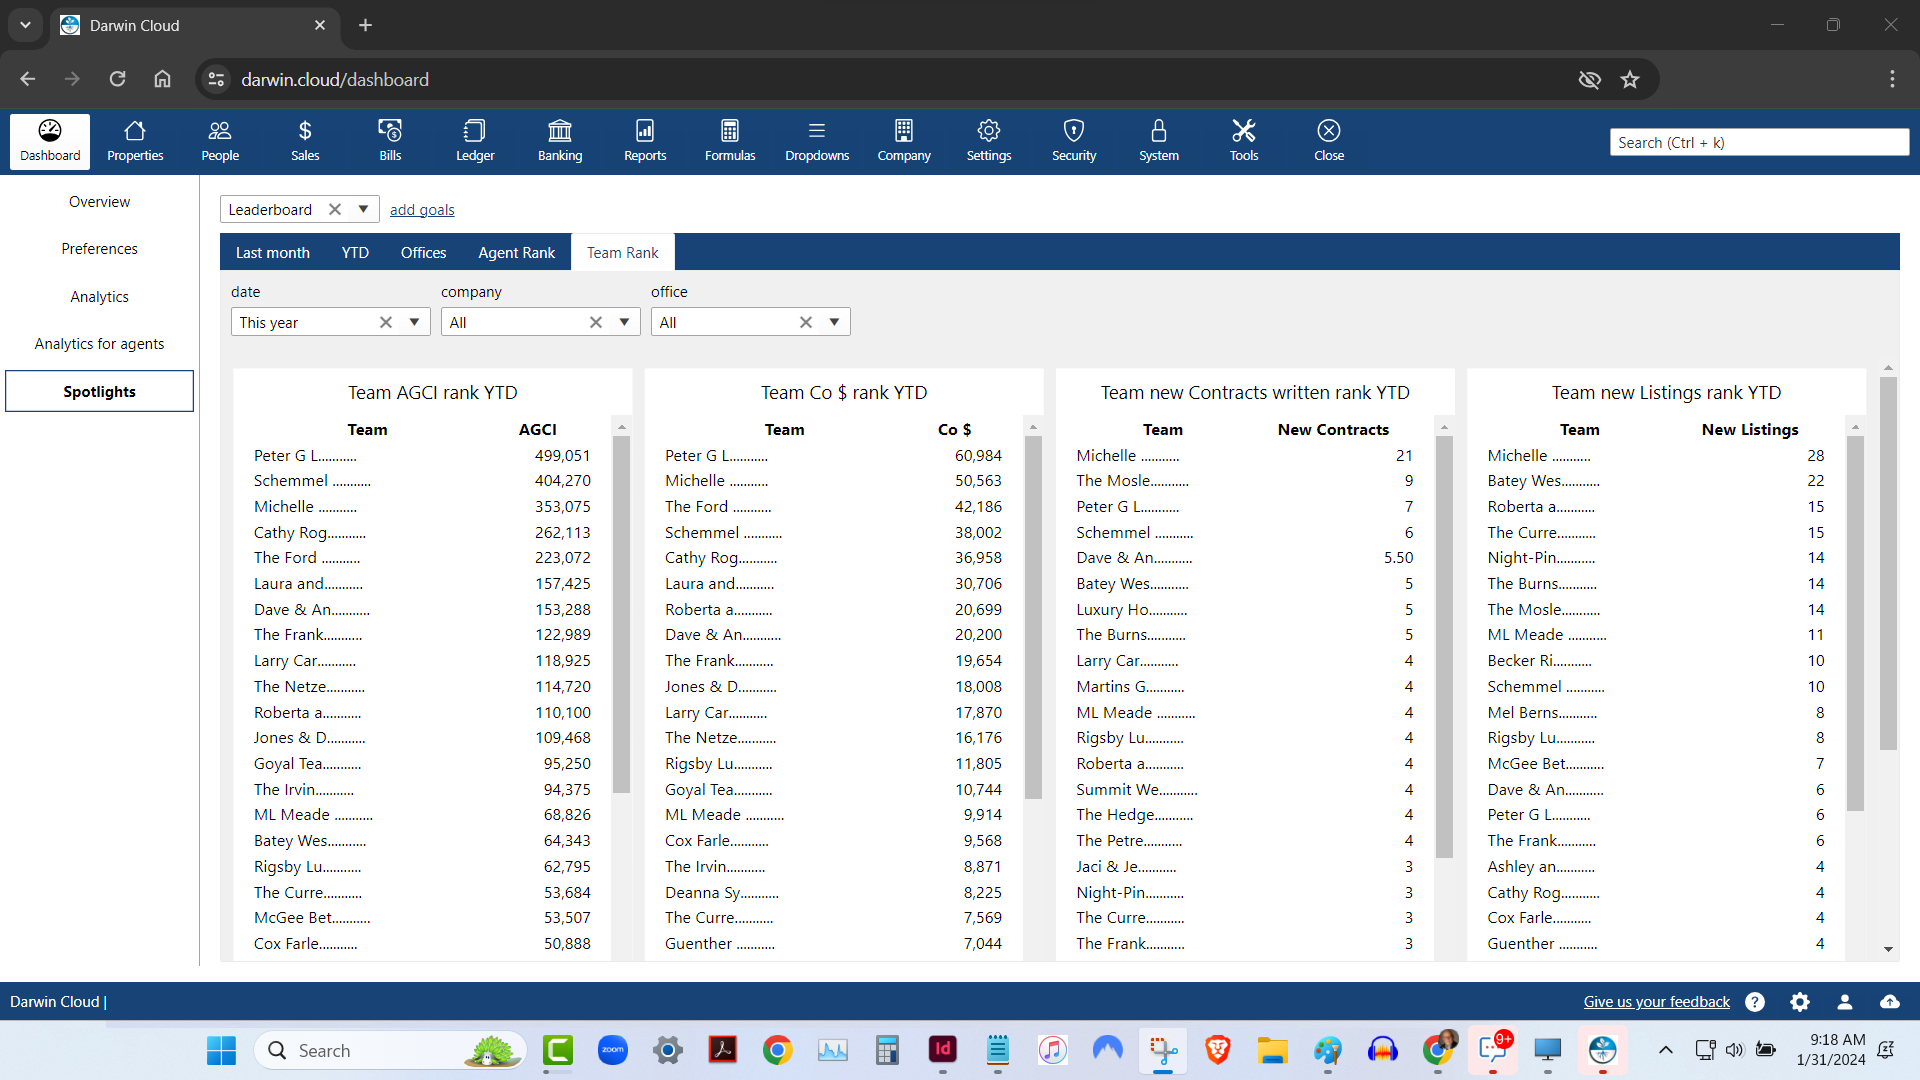
Spotlight Analytics: Team Rank Leaderboard
KPI Spotlight: Team Rank Leaderboard. Spotlights are the newest and best way to see how your company is performing. Using a collection of key performance indicators, you can quickly see which of your Teams is performing best - based on 4 essential KPI.
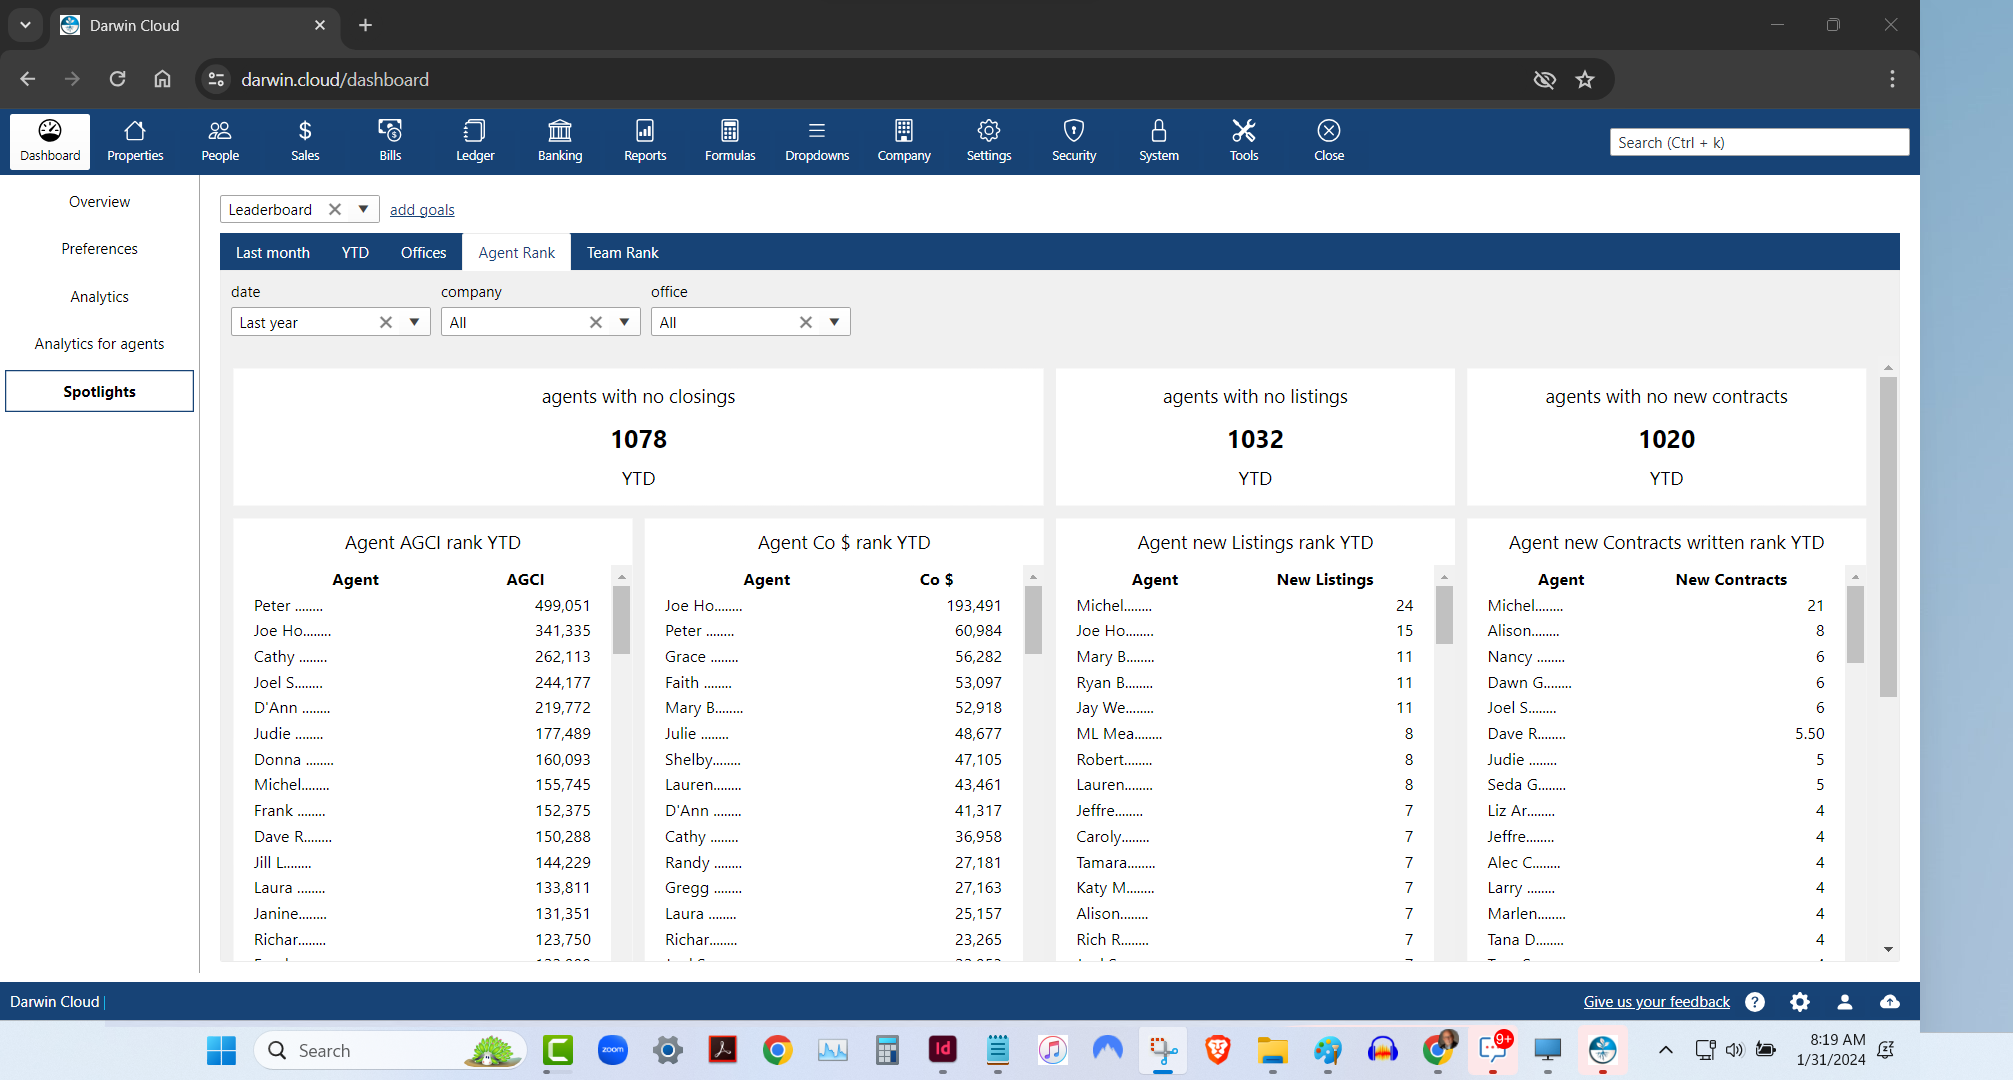
Spotlight Analytics: Agent Rank Leaderboard
KPI Spotlight: Agent Rank Leaderboard. Spotlights are the newest and best way to see how your company is performing. Using a collection of key performance indicators, you can quickly see which of your Agents are performing best - based on 4 essential KPI.
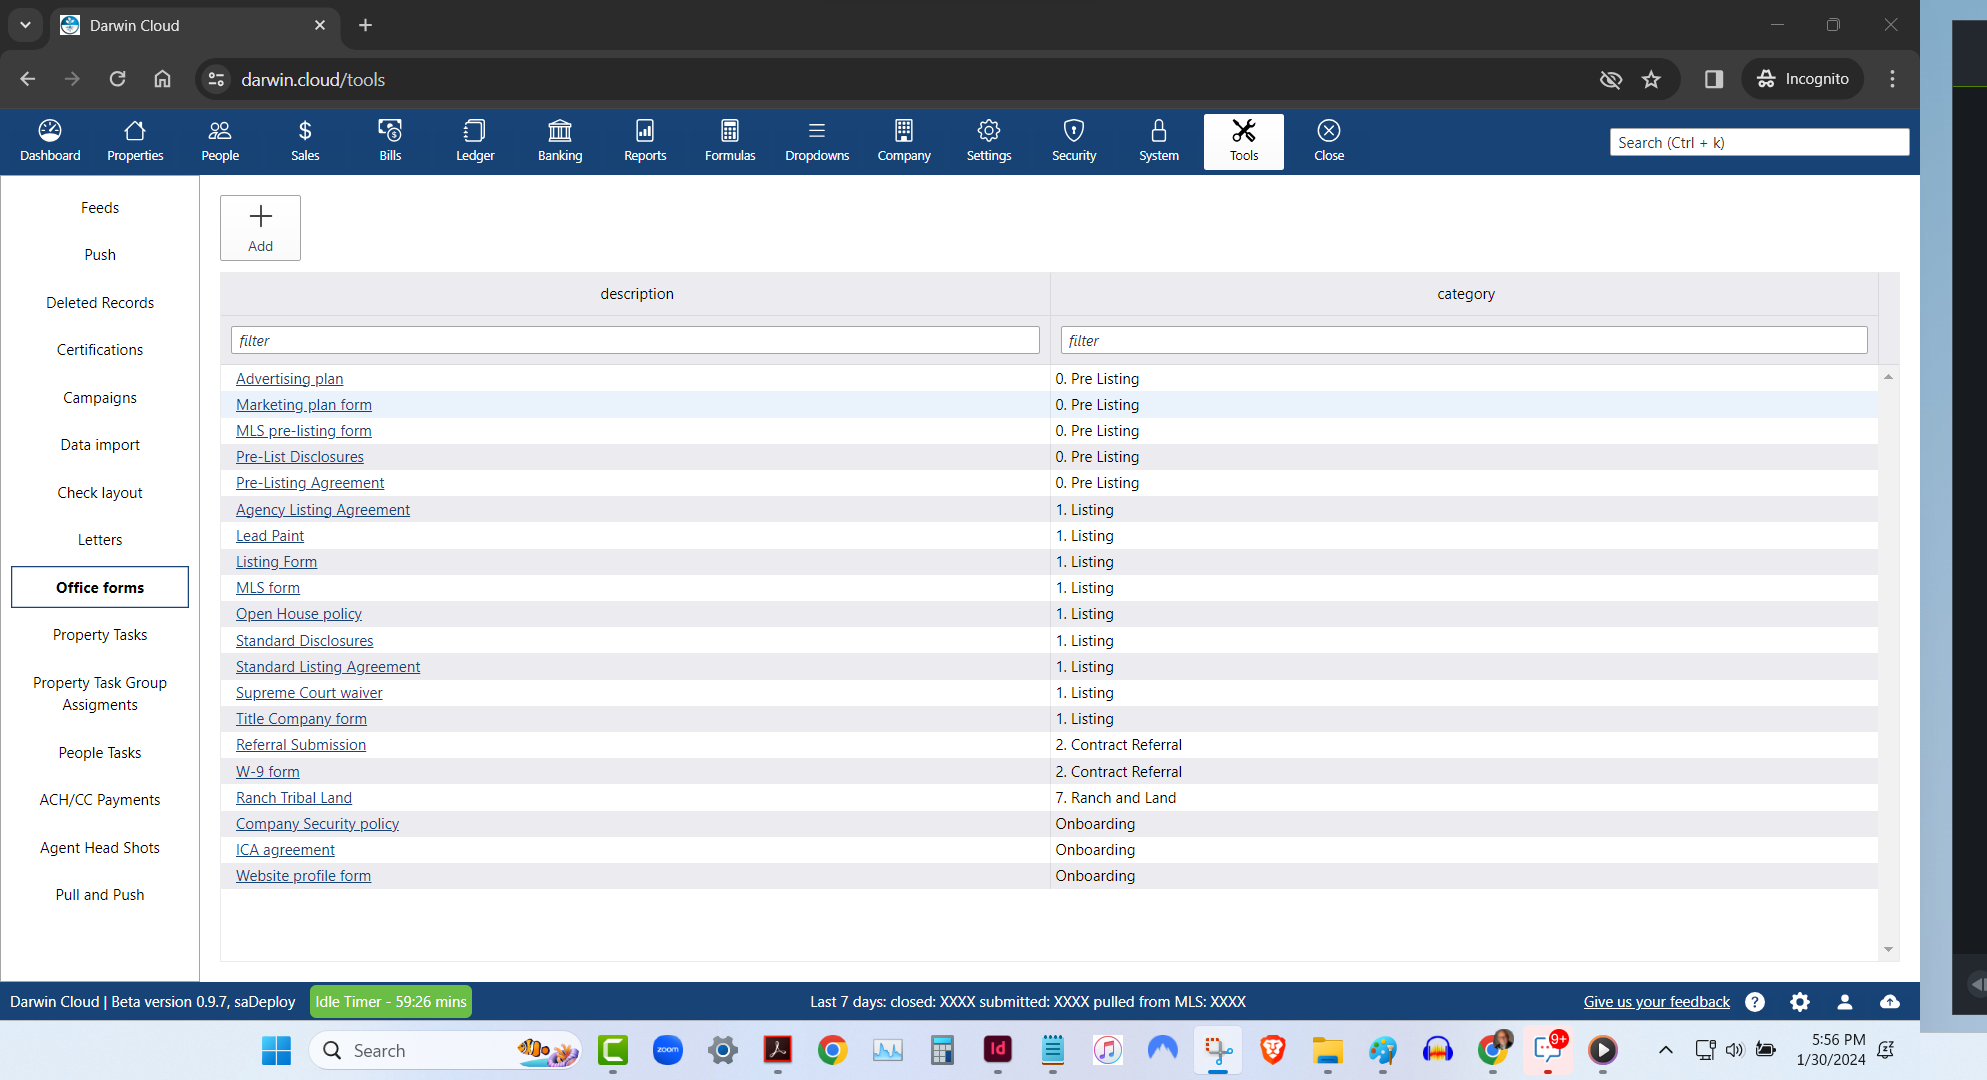
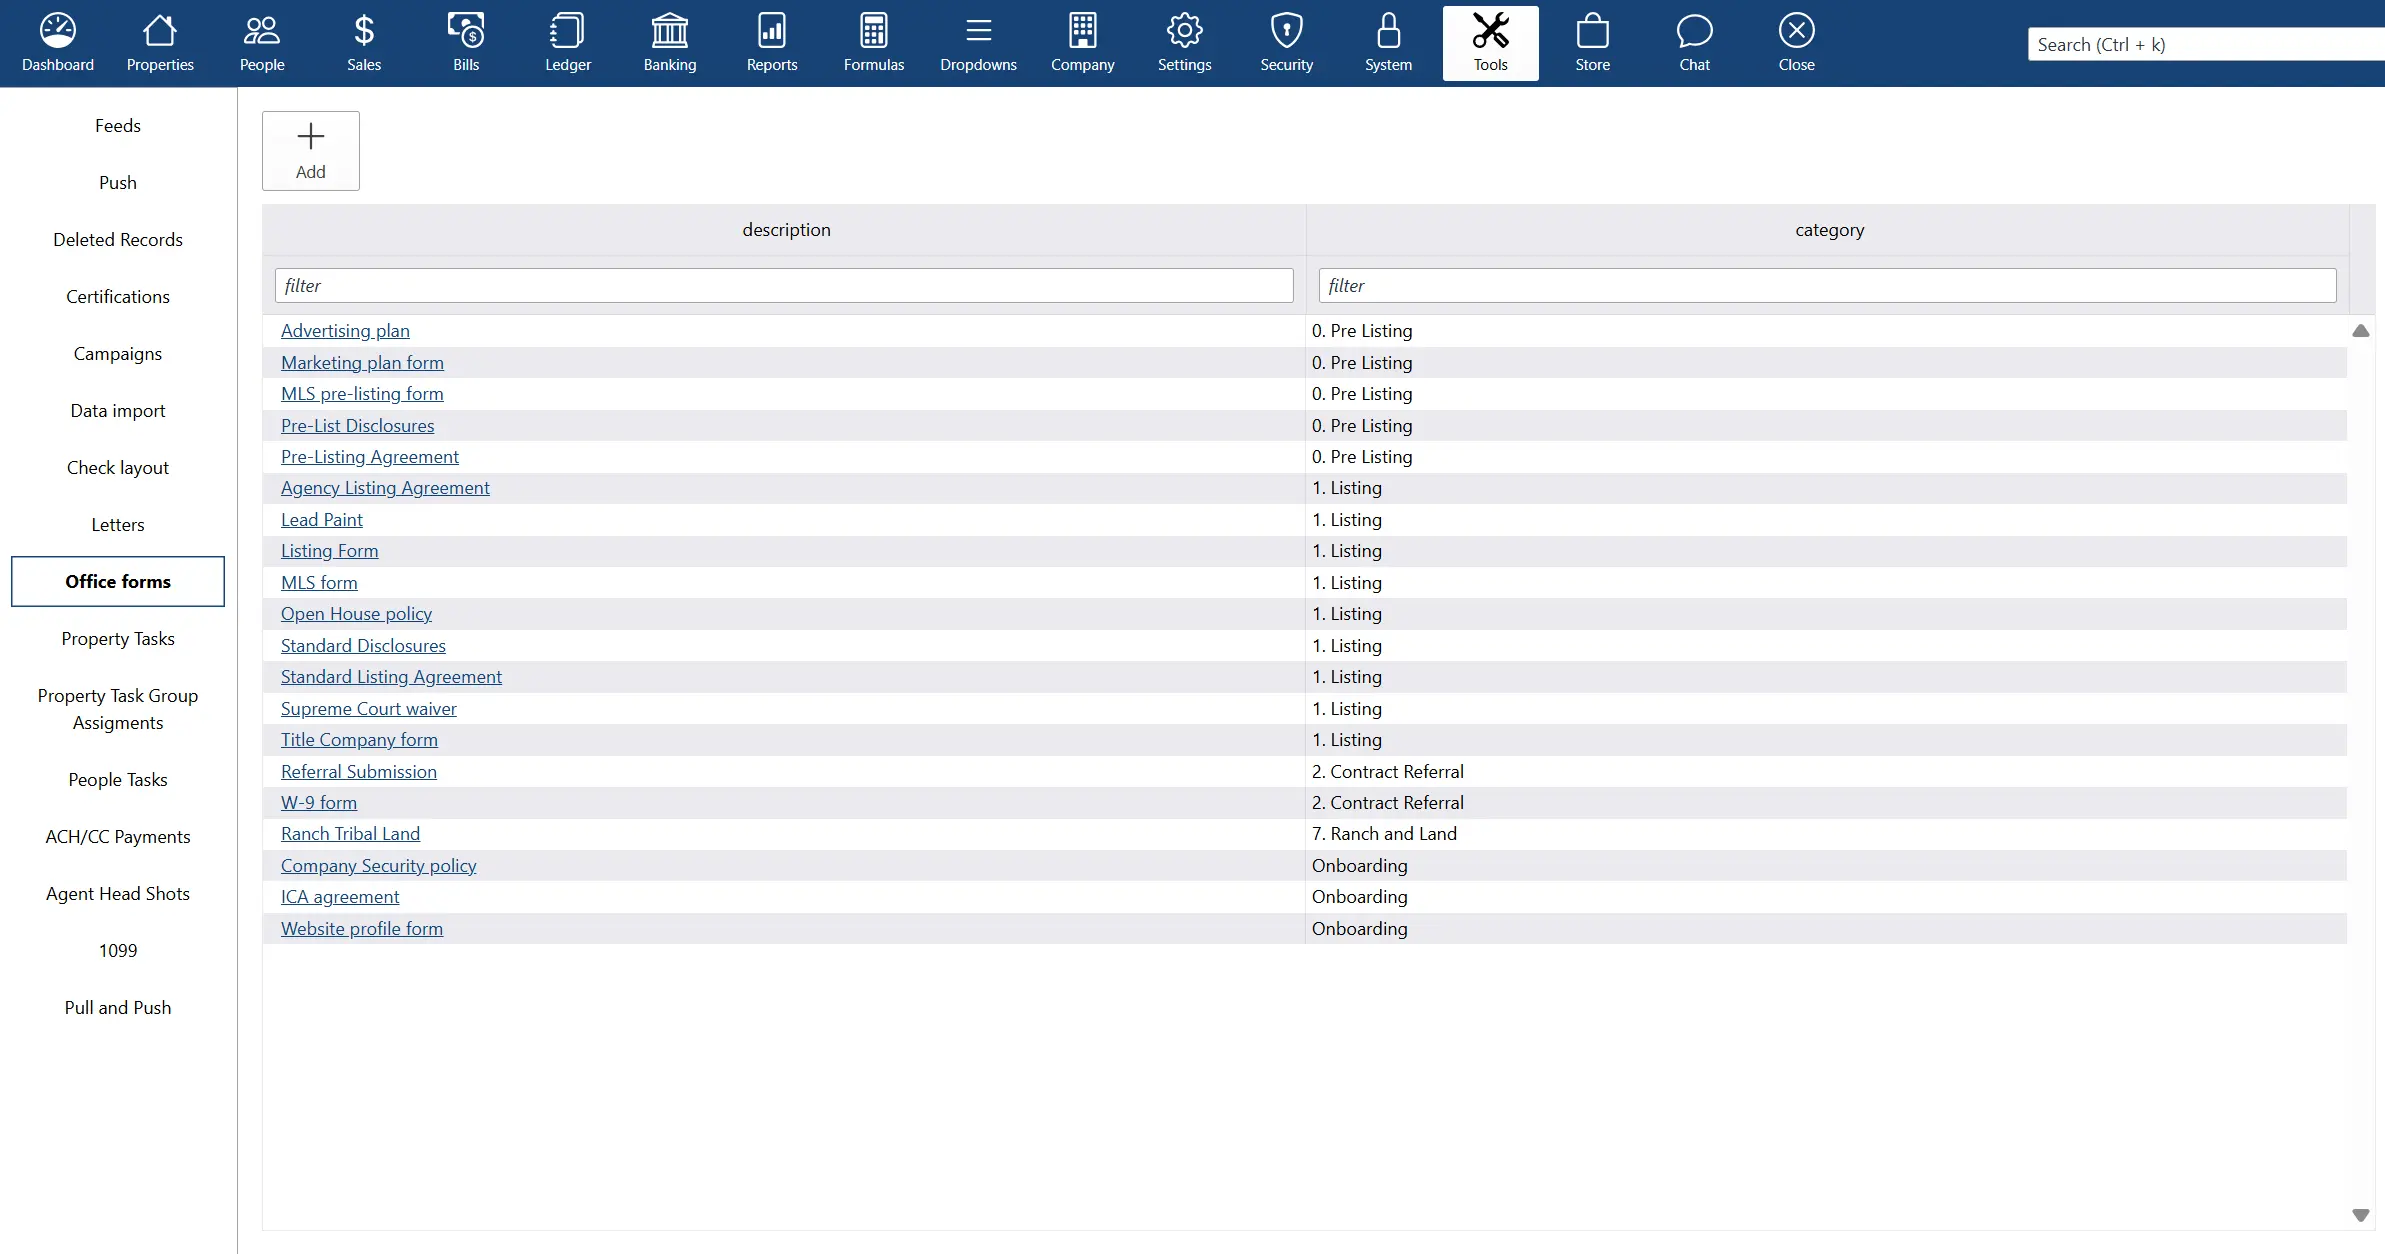
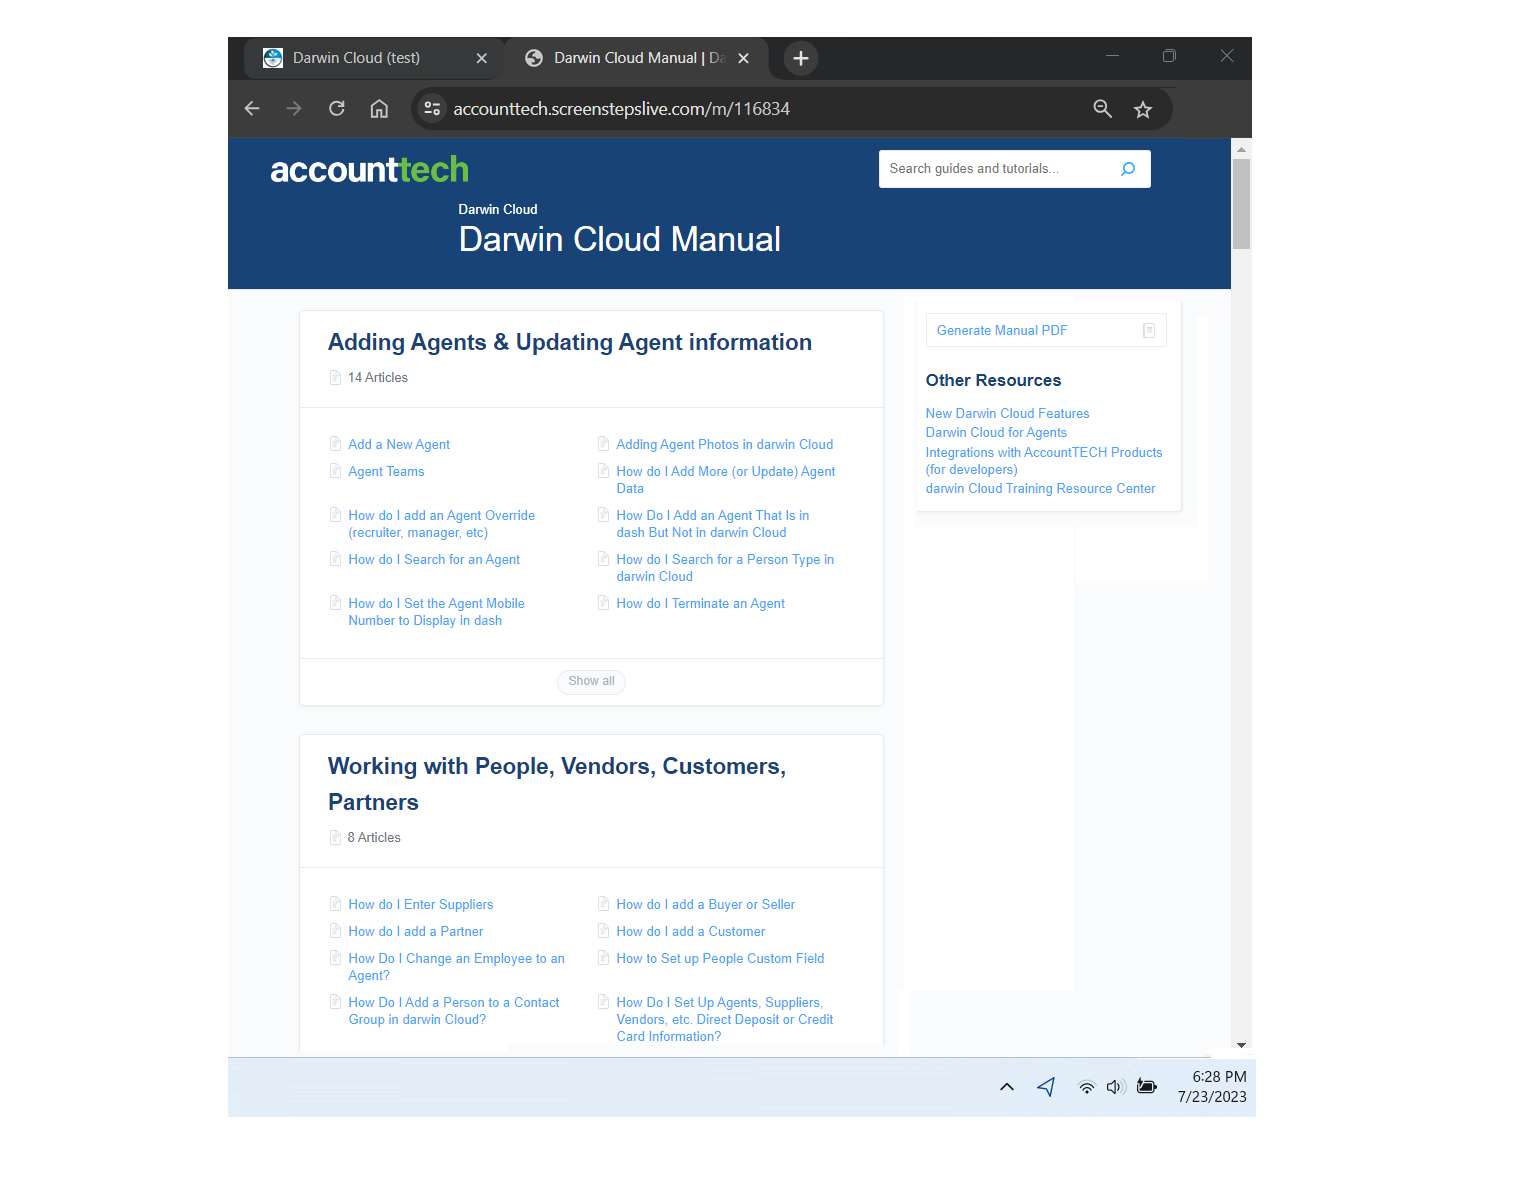
New darwin.Cloud feature: Office Forms Library
Store all the forms your agents need in the Office forms library
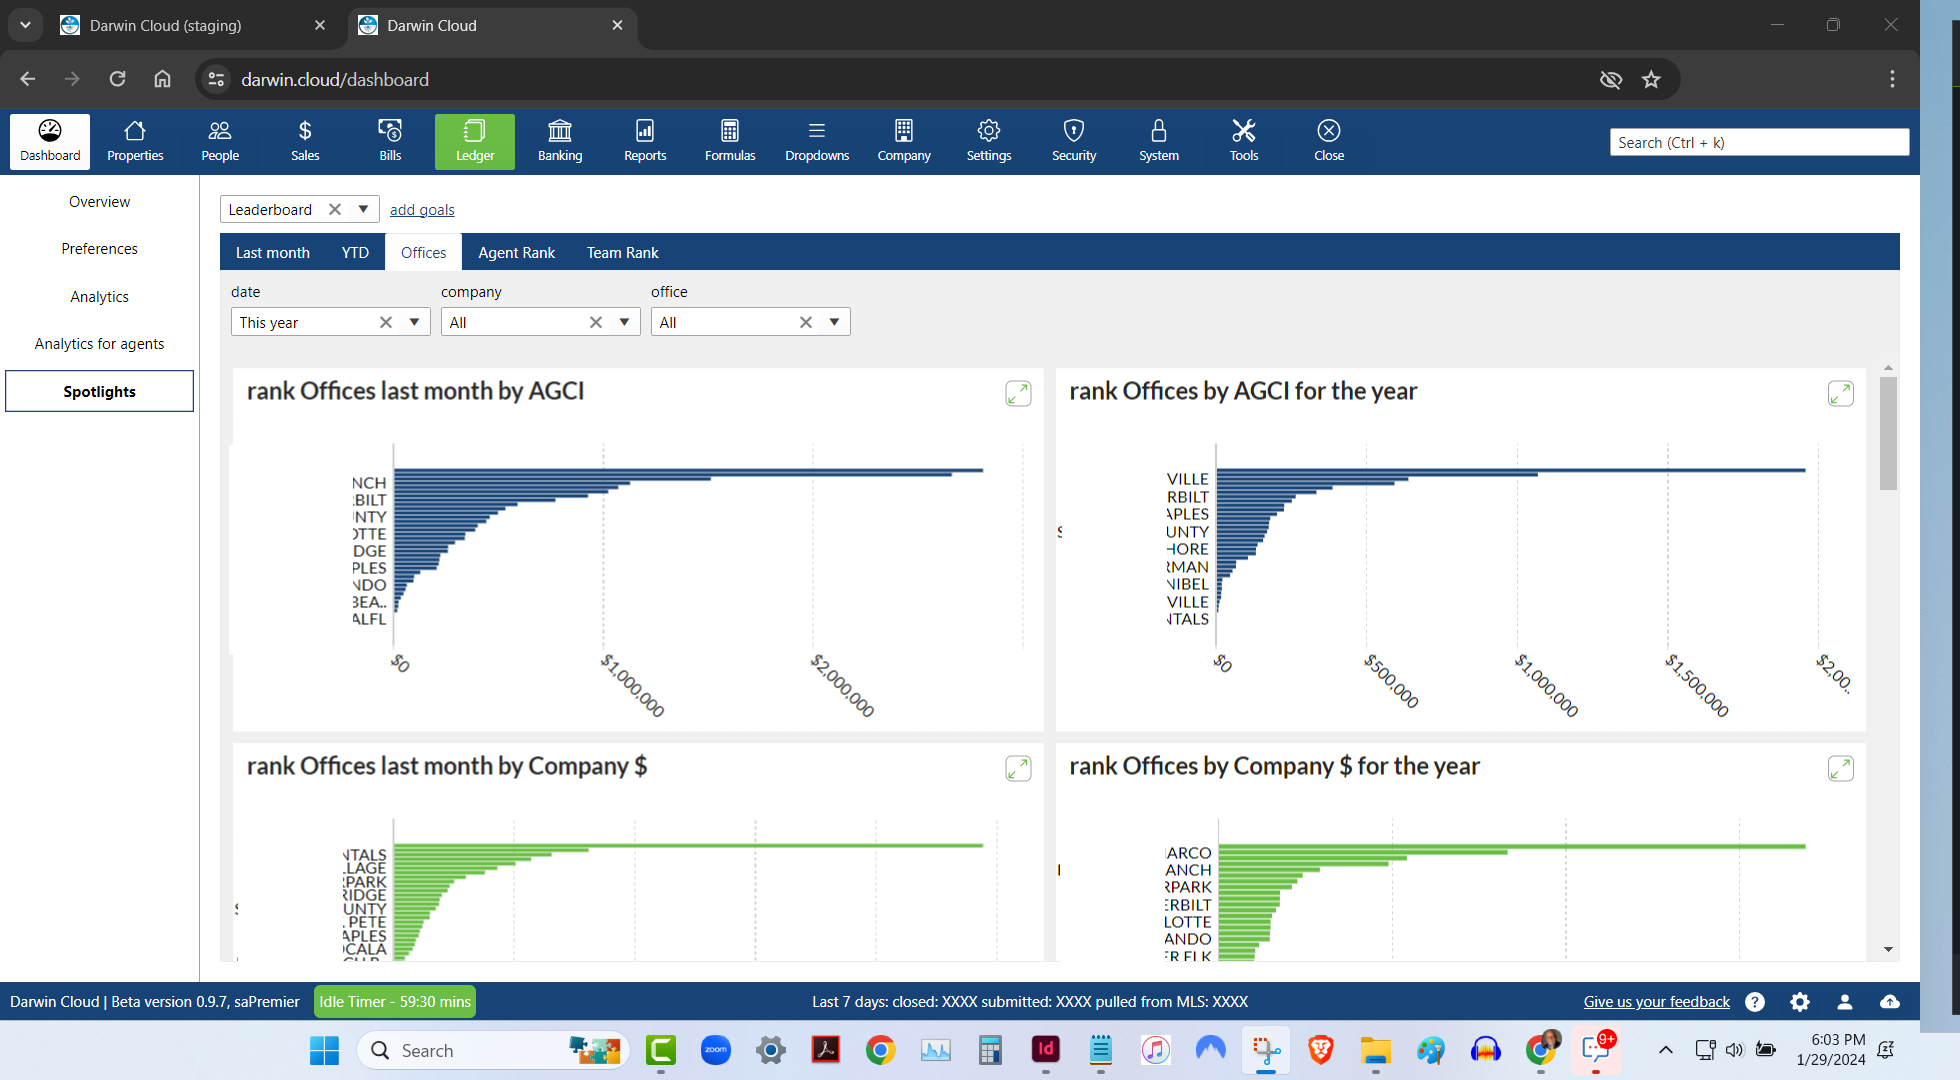
Spotlight Analytics: Office Rank Leaderboard
KPI Spotlight: Office Rank Leaderboard. Spotlights are the newest and best way to see how your company is performing. Using a collection of key performance indicators, you can quickly see which of your offices are performing best - based on 6 different metrics.
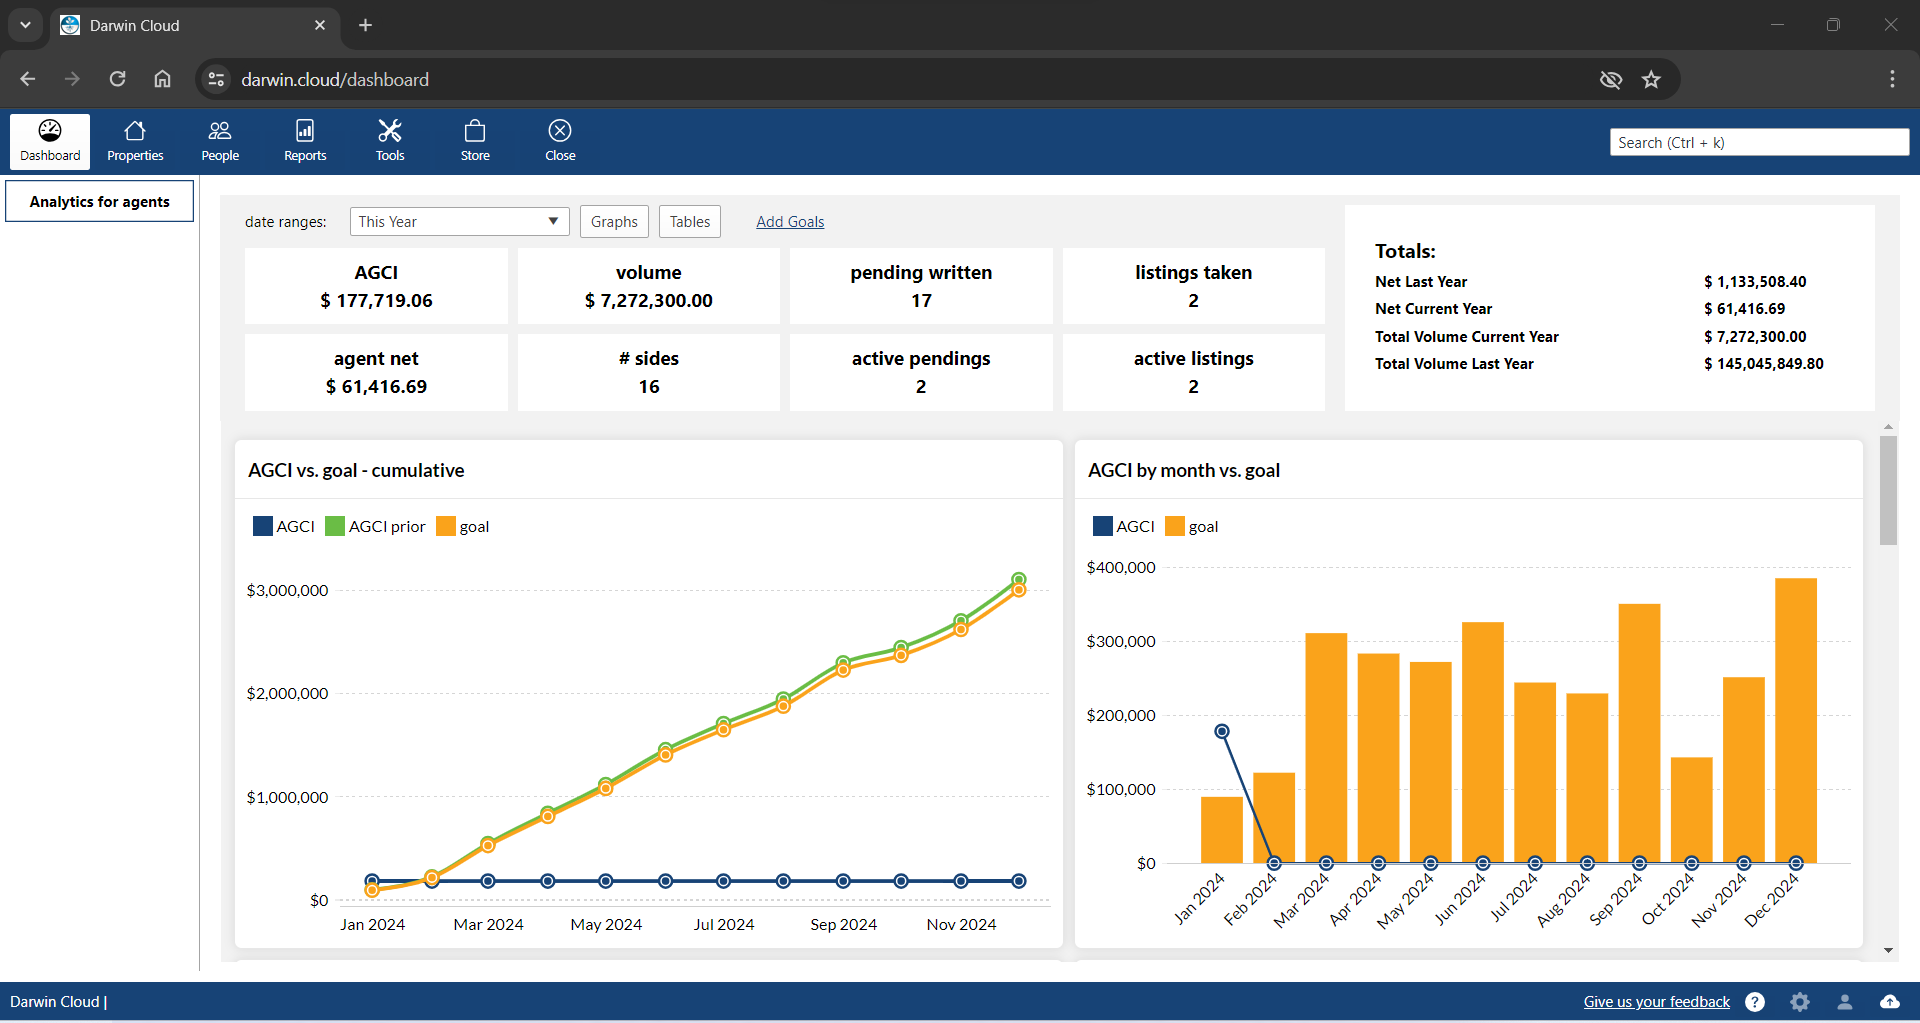
New darwin.Cloud feature: Customized Agent dashboards
<p>Now you can customize your Agent dashboards to highlight the most important numbers your Agents want to see. </p>
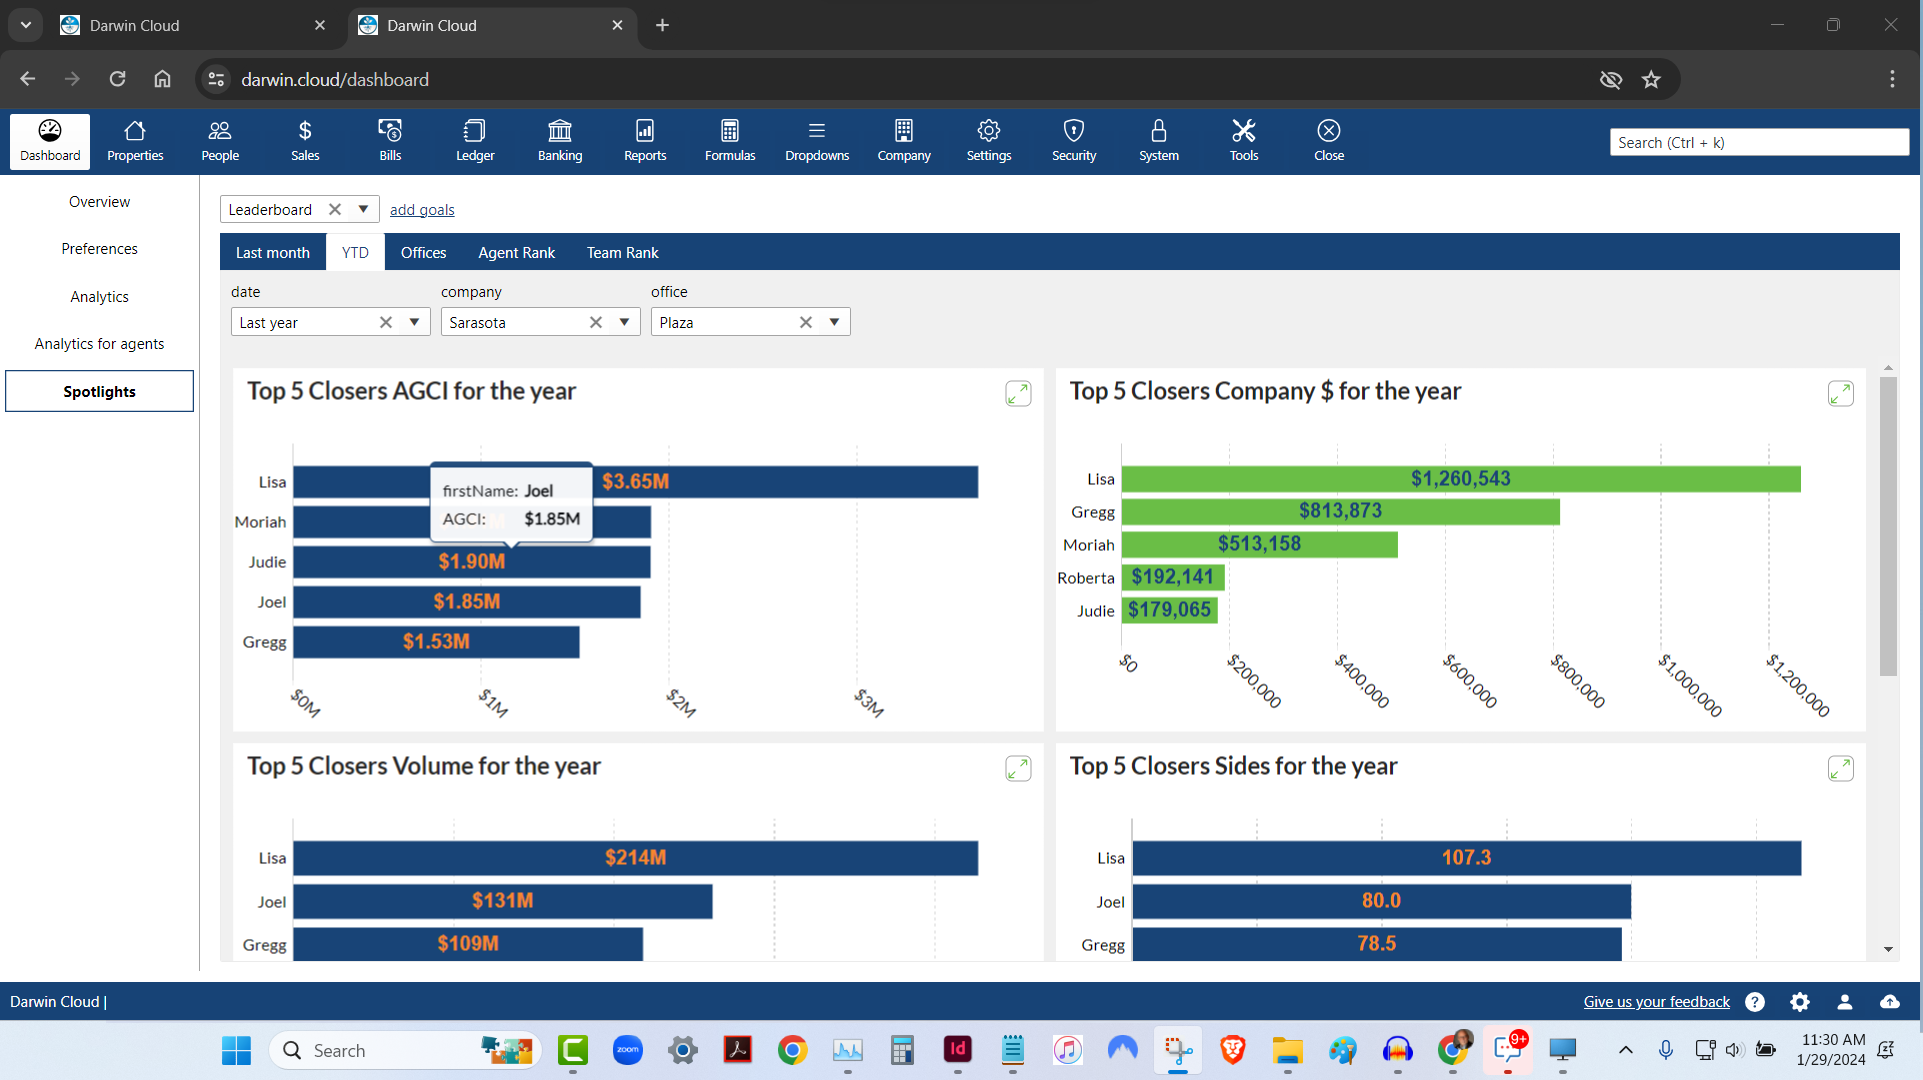
Spotlight Analytics: Top 5 Agent Leaderboard
KPI Spotlight: Top 5 Agents Leaderboard. Spotlights are the newest and best way to see how your company is performing. Using a collection of key performance indicators, you can quickly see the Top 5 Agents based on 6 different metrics.
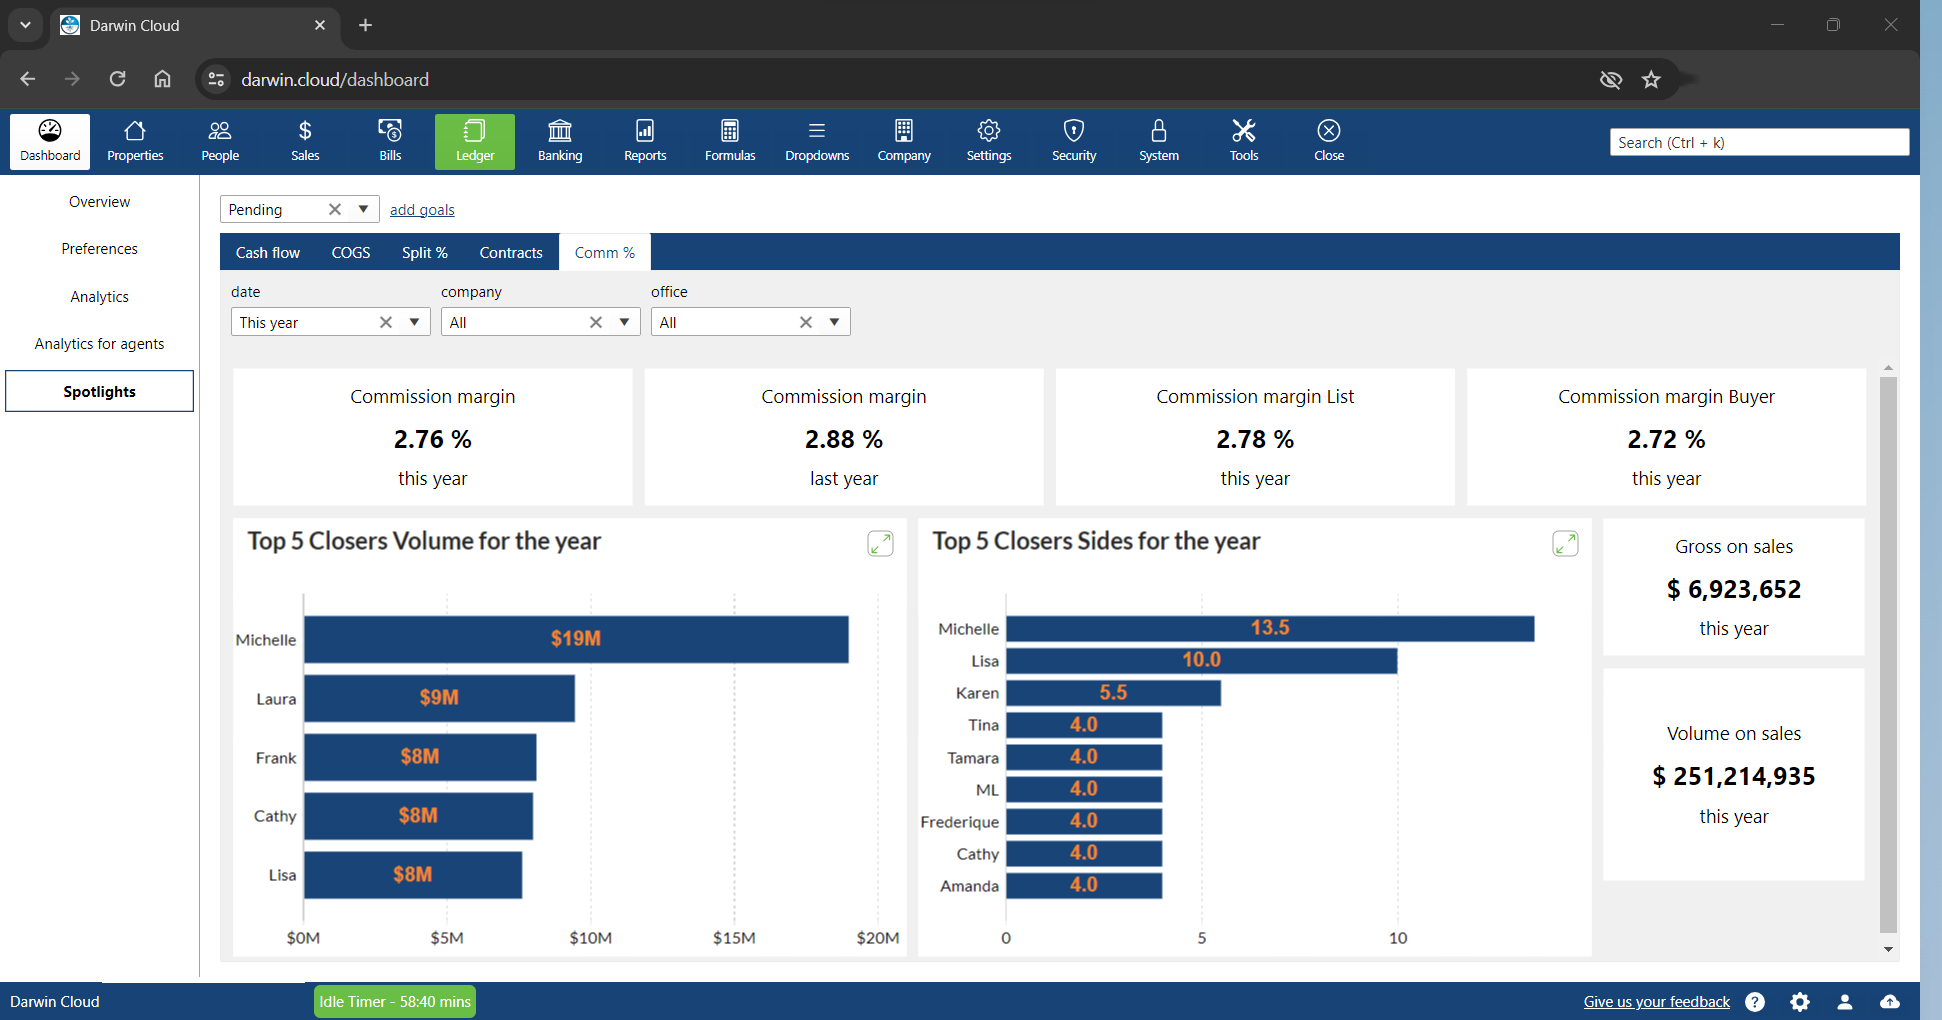
Spotlight KPI: Commission margins
KPI Spotlight: New Contracts written. Spotlights are the newest and best way to see how your company is performing. Using a collection of key performance indicators, you can quickly see the Commission percentages your agents are charging to Buyers and Sellers.
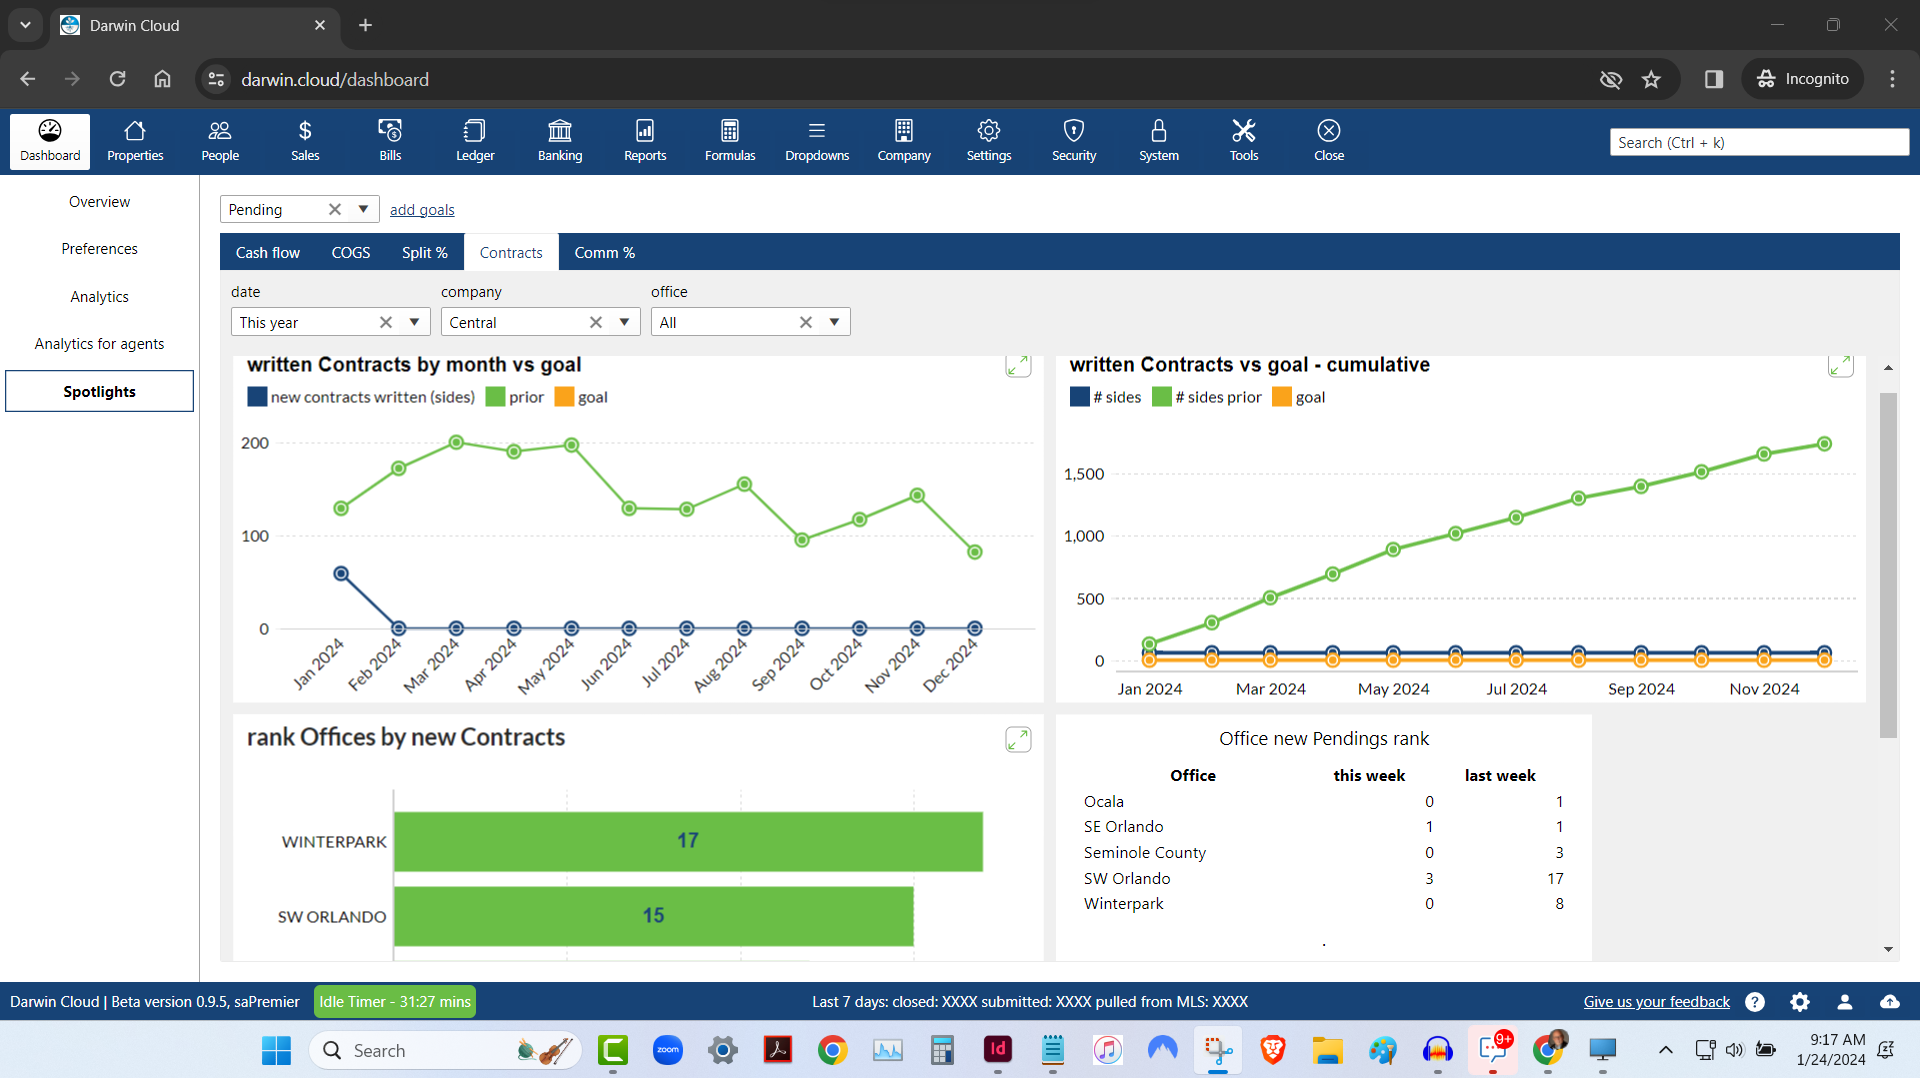
Spotlight KPI: New Contracts written
KPI Spotlight: New Contracts written. Spotlights are the newest and best way to see how your company is performing. Using a collection of key performance indicators to see how many new Contracts your agents are writing.
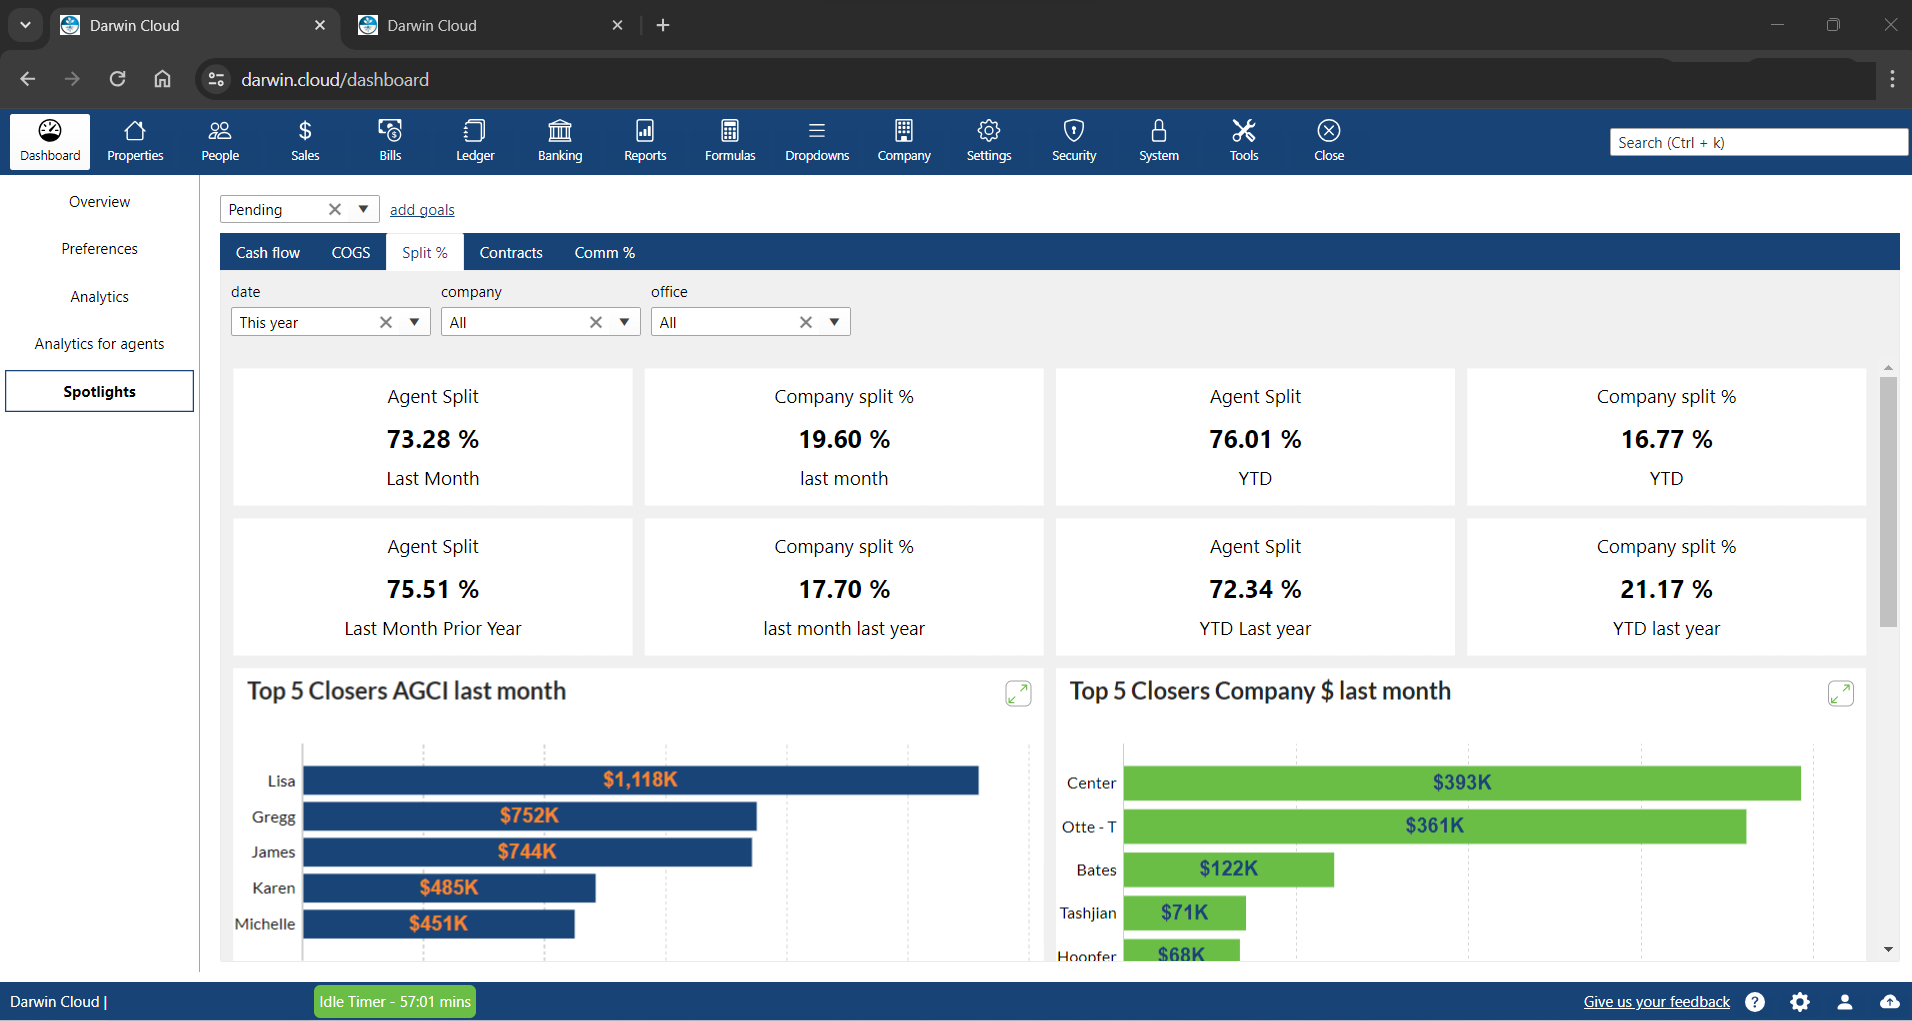
Spotlight KPI: Commission Split percentages
KPI Spotlight: Commission split percentages. Spotlights are the newest and best way to see how your company is performing. Using a collection of key performance indicators to see what percentage your company has paid in split percentages last month and Year to Date.
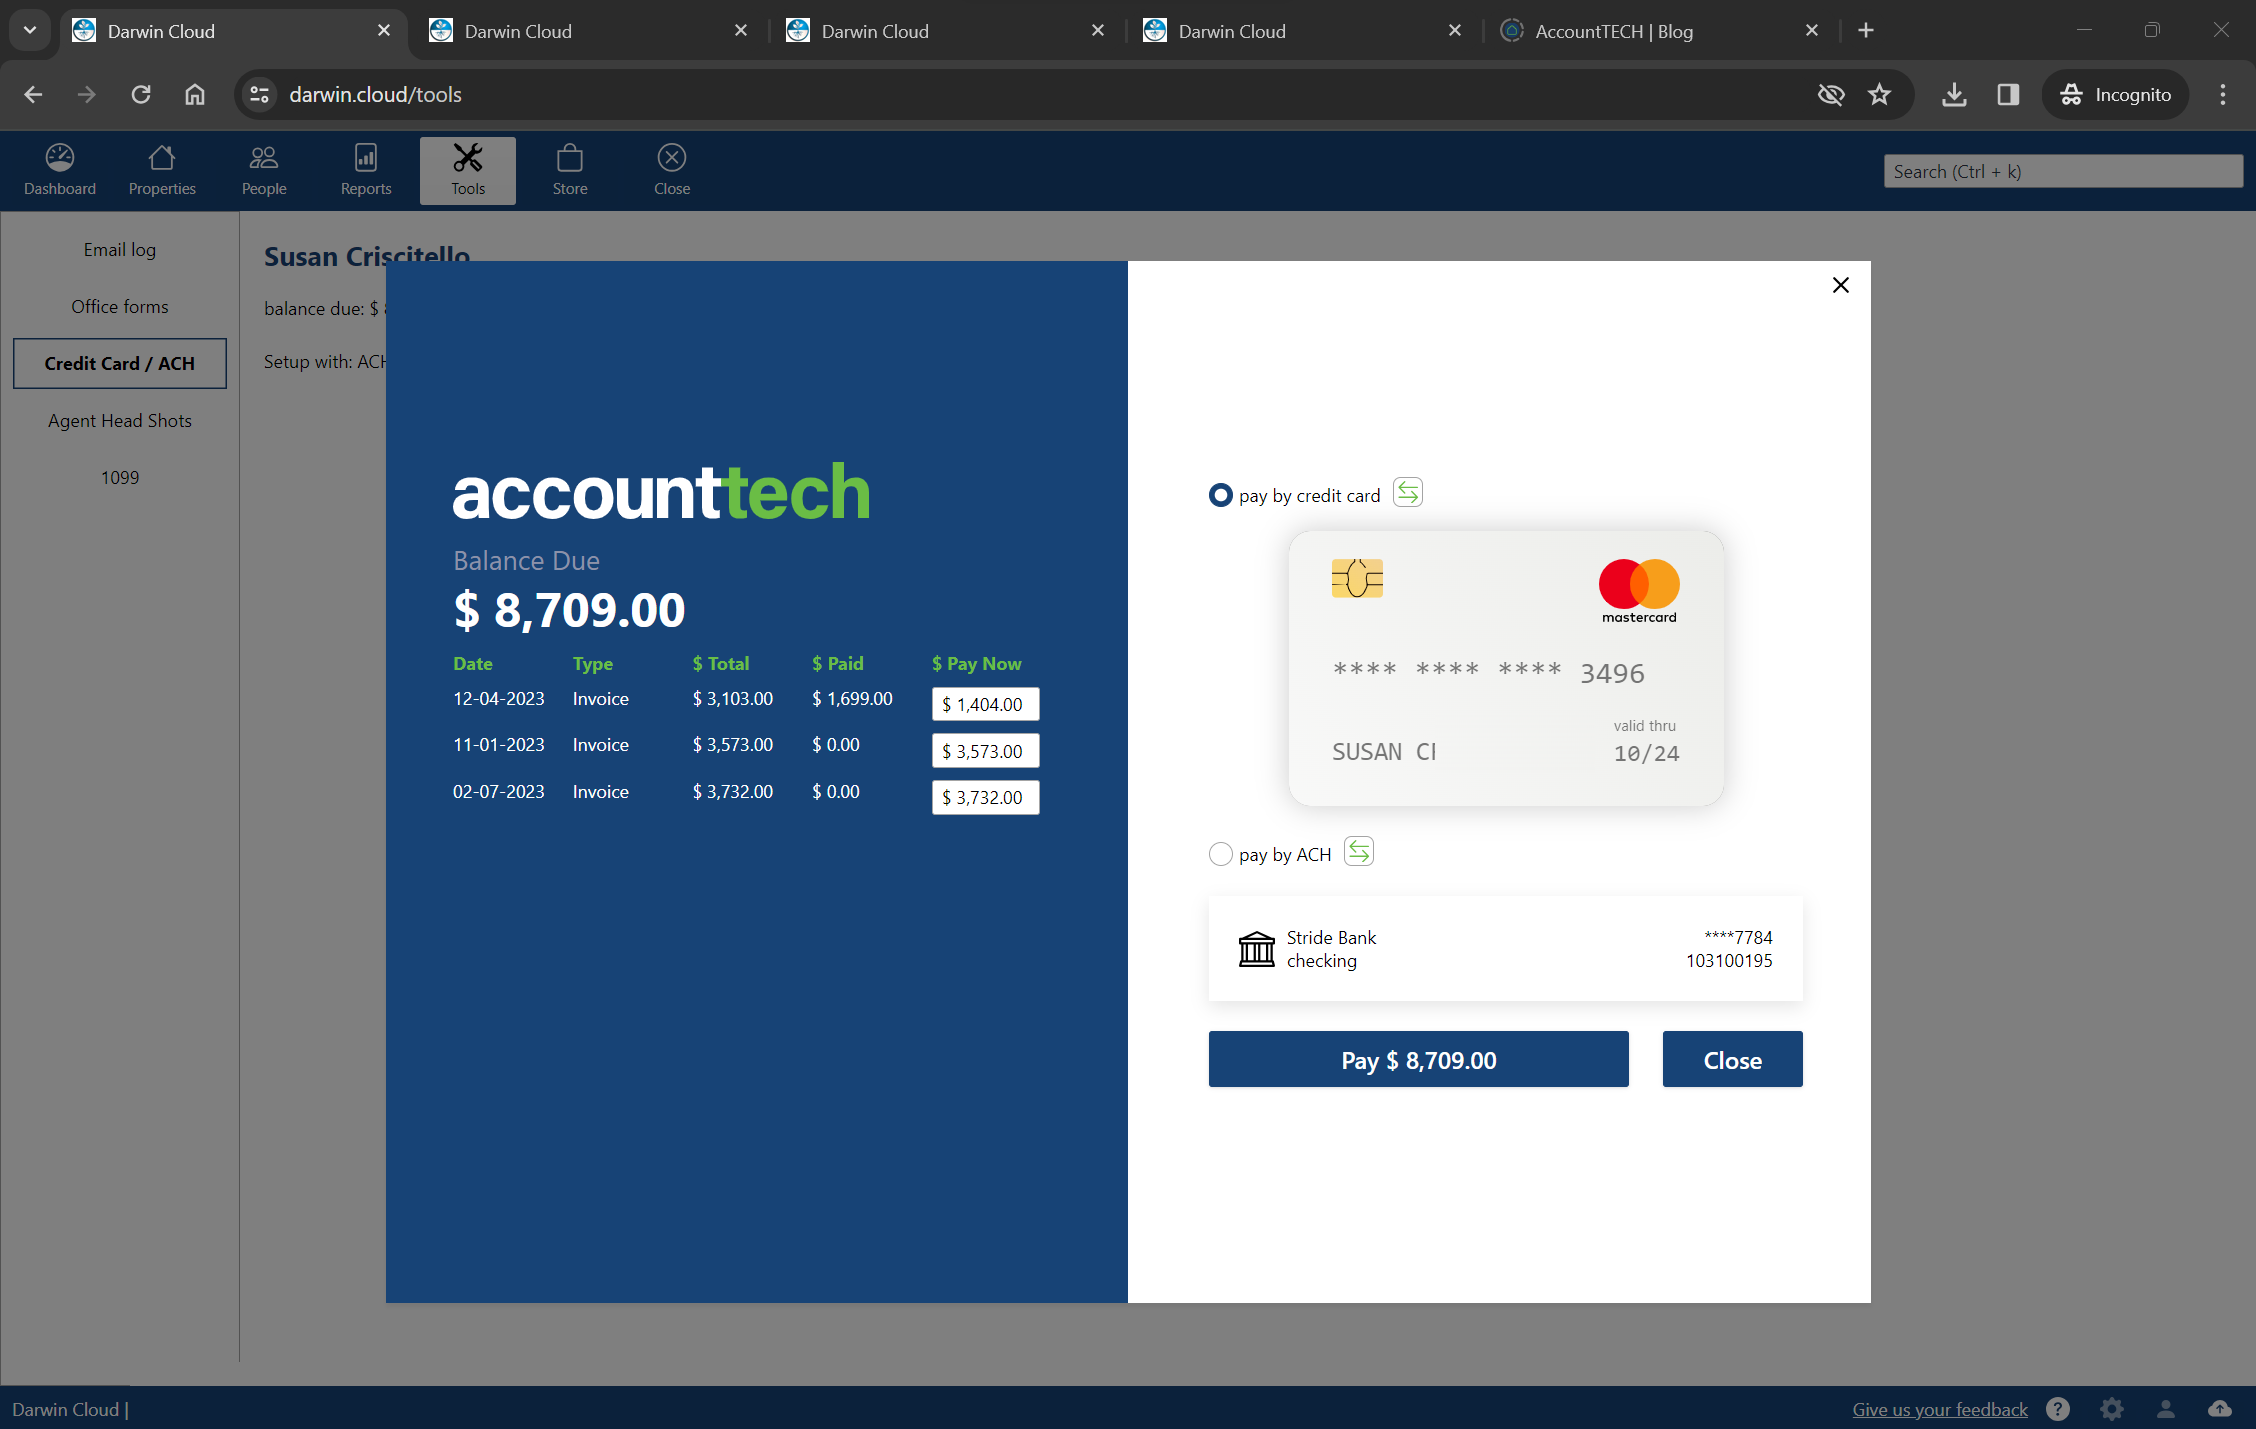
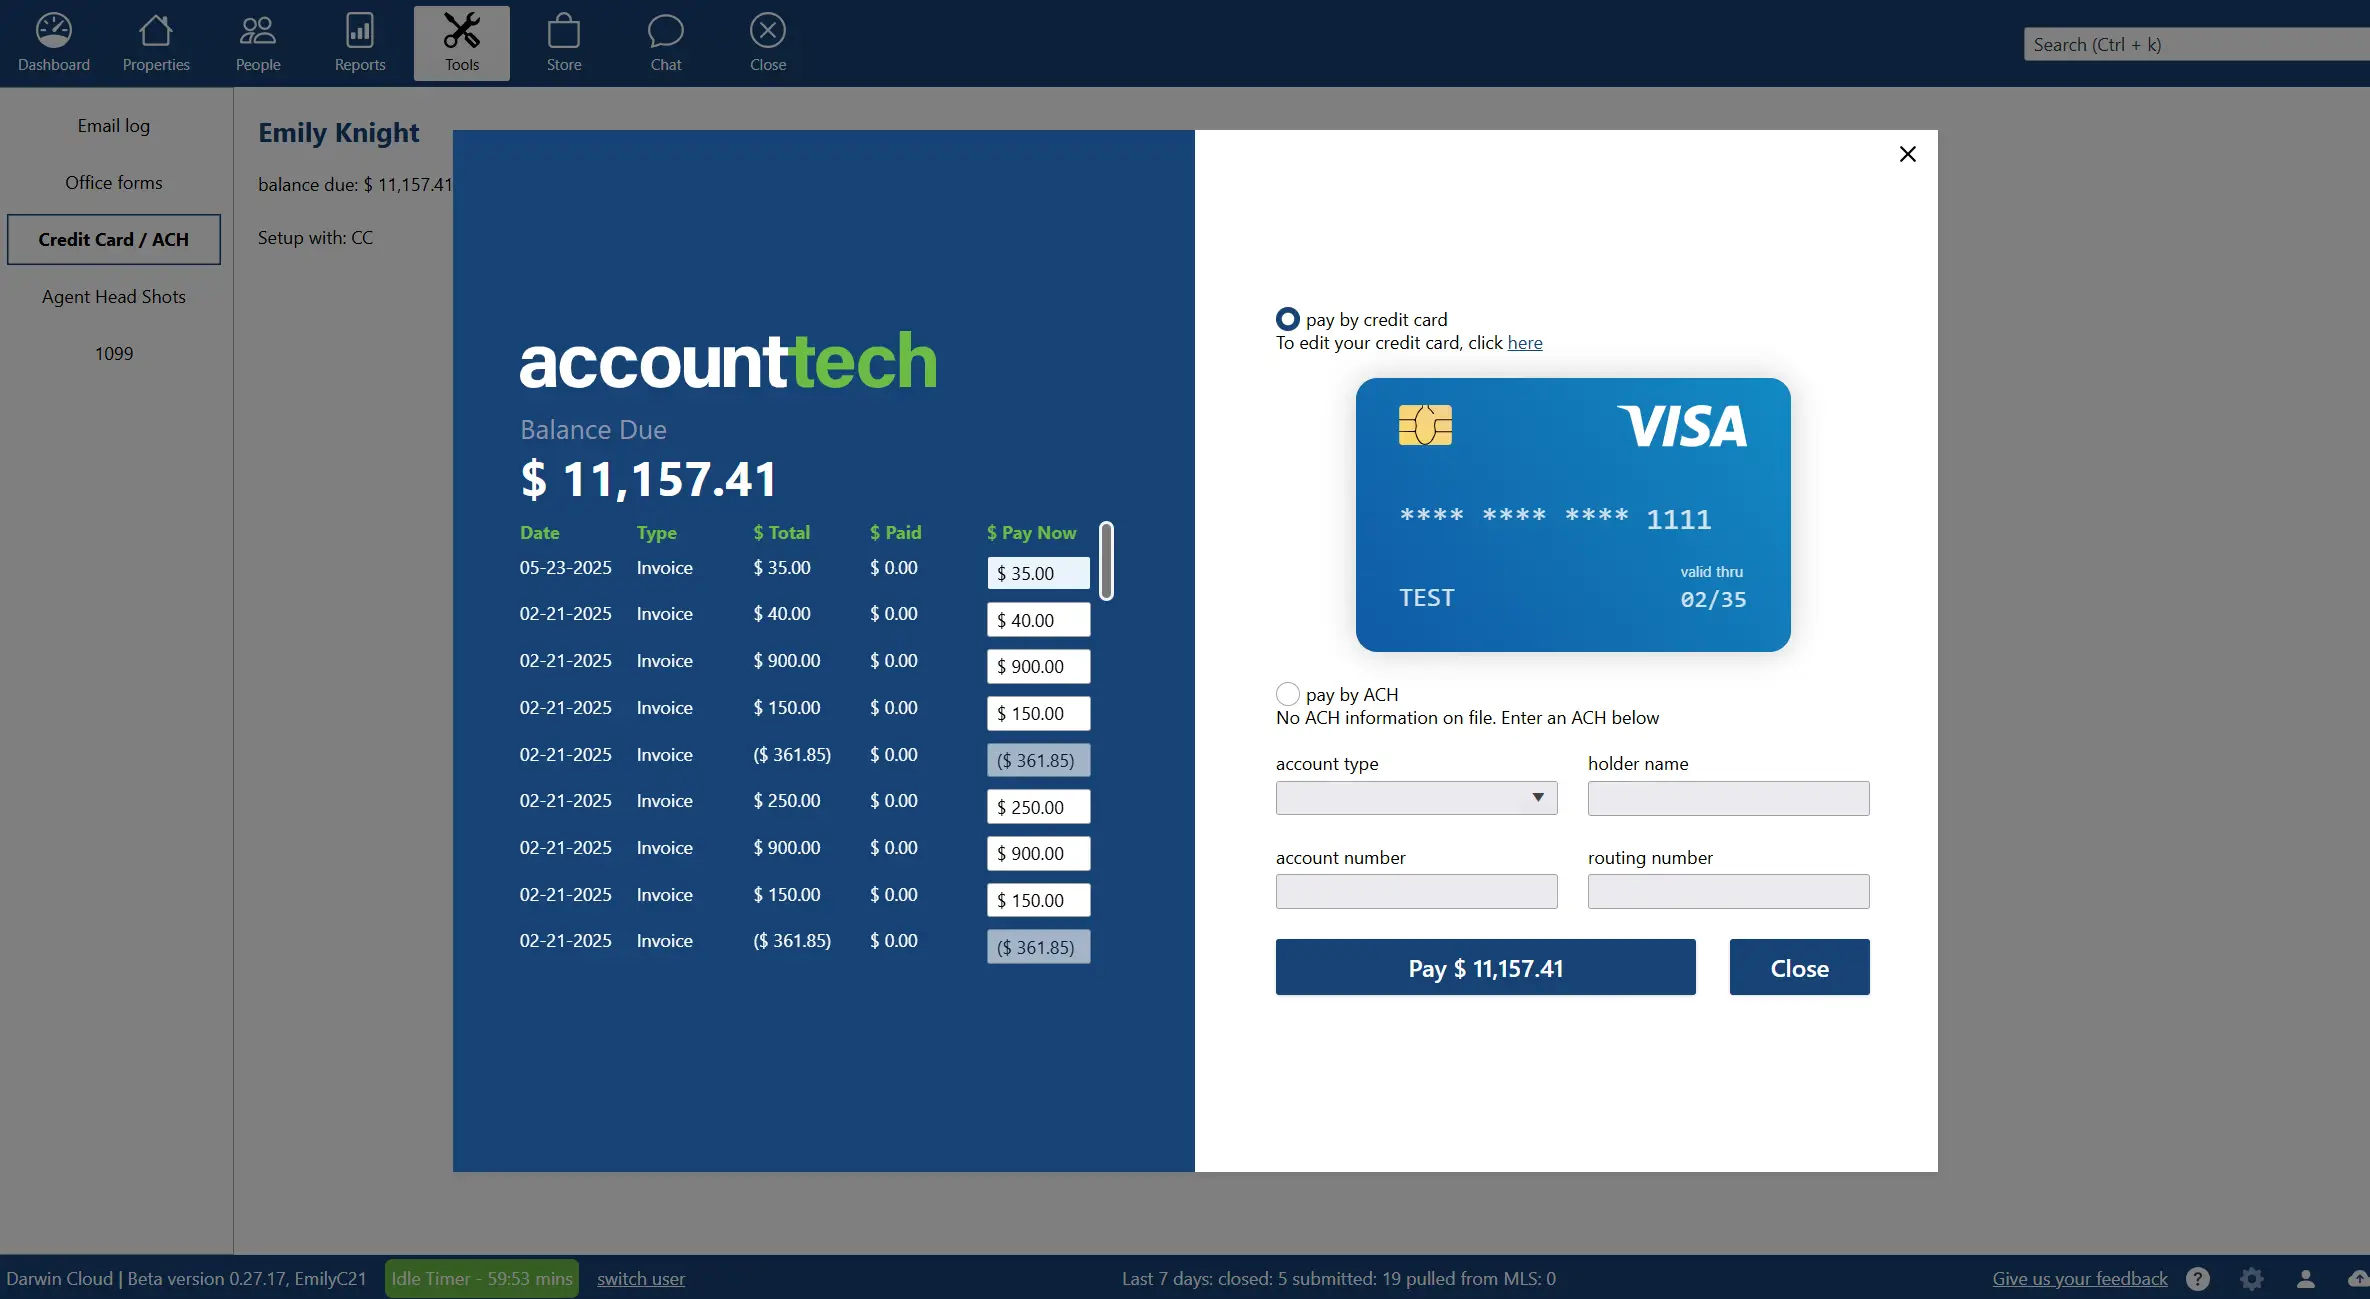
NEW darwin.Cloud feature: Agent Bill Pay
darwin.Cloud now enables agents to Pay their bills real-time, on-demand in darwin.Cloud. When an agent wants to "settle-up", they can pay by credit card or ACH

Spotlight KPI: Pending Cost of Goods Sold
KPI Spotlight: cost of goods sold. Spotlights are the newest and best way to see how your company is performing. Using a collection of key performance metrics, you can quickly get to critical information that drives your company's success.
NEW darwin.Cloud feature: Agent email campaign history
darwin.Cloud now deliivers Email campaign copies to agents. When an agent needs a copy of a commission statement, invoice statement or hot sheet - they will find them all in their campaign history.
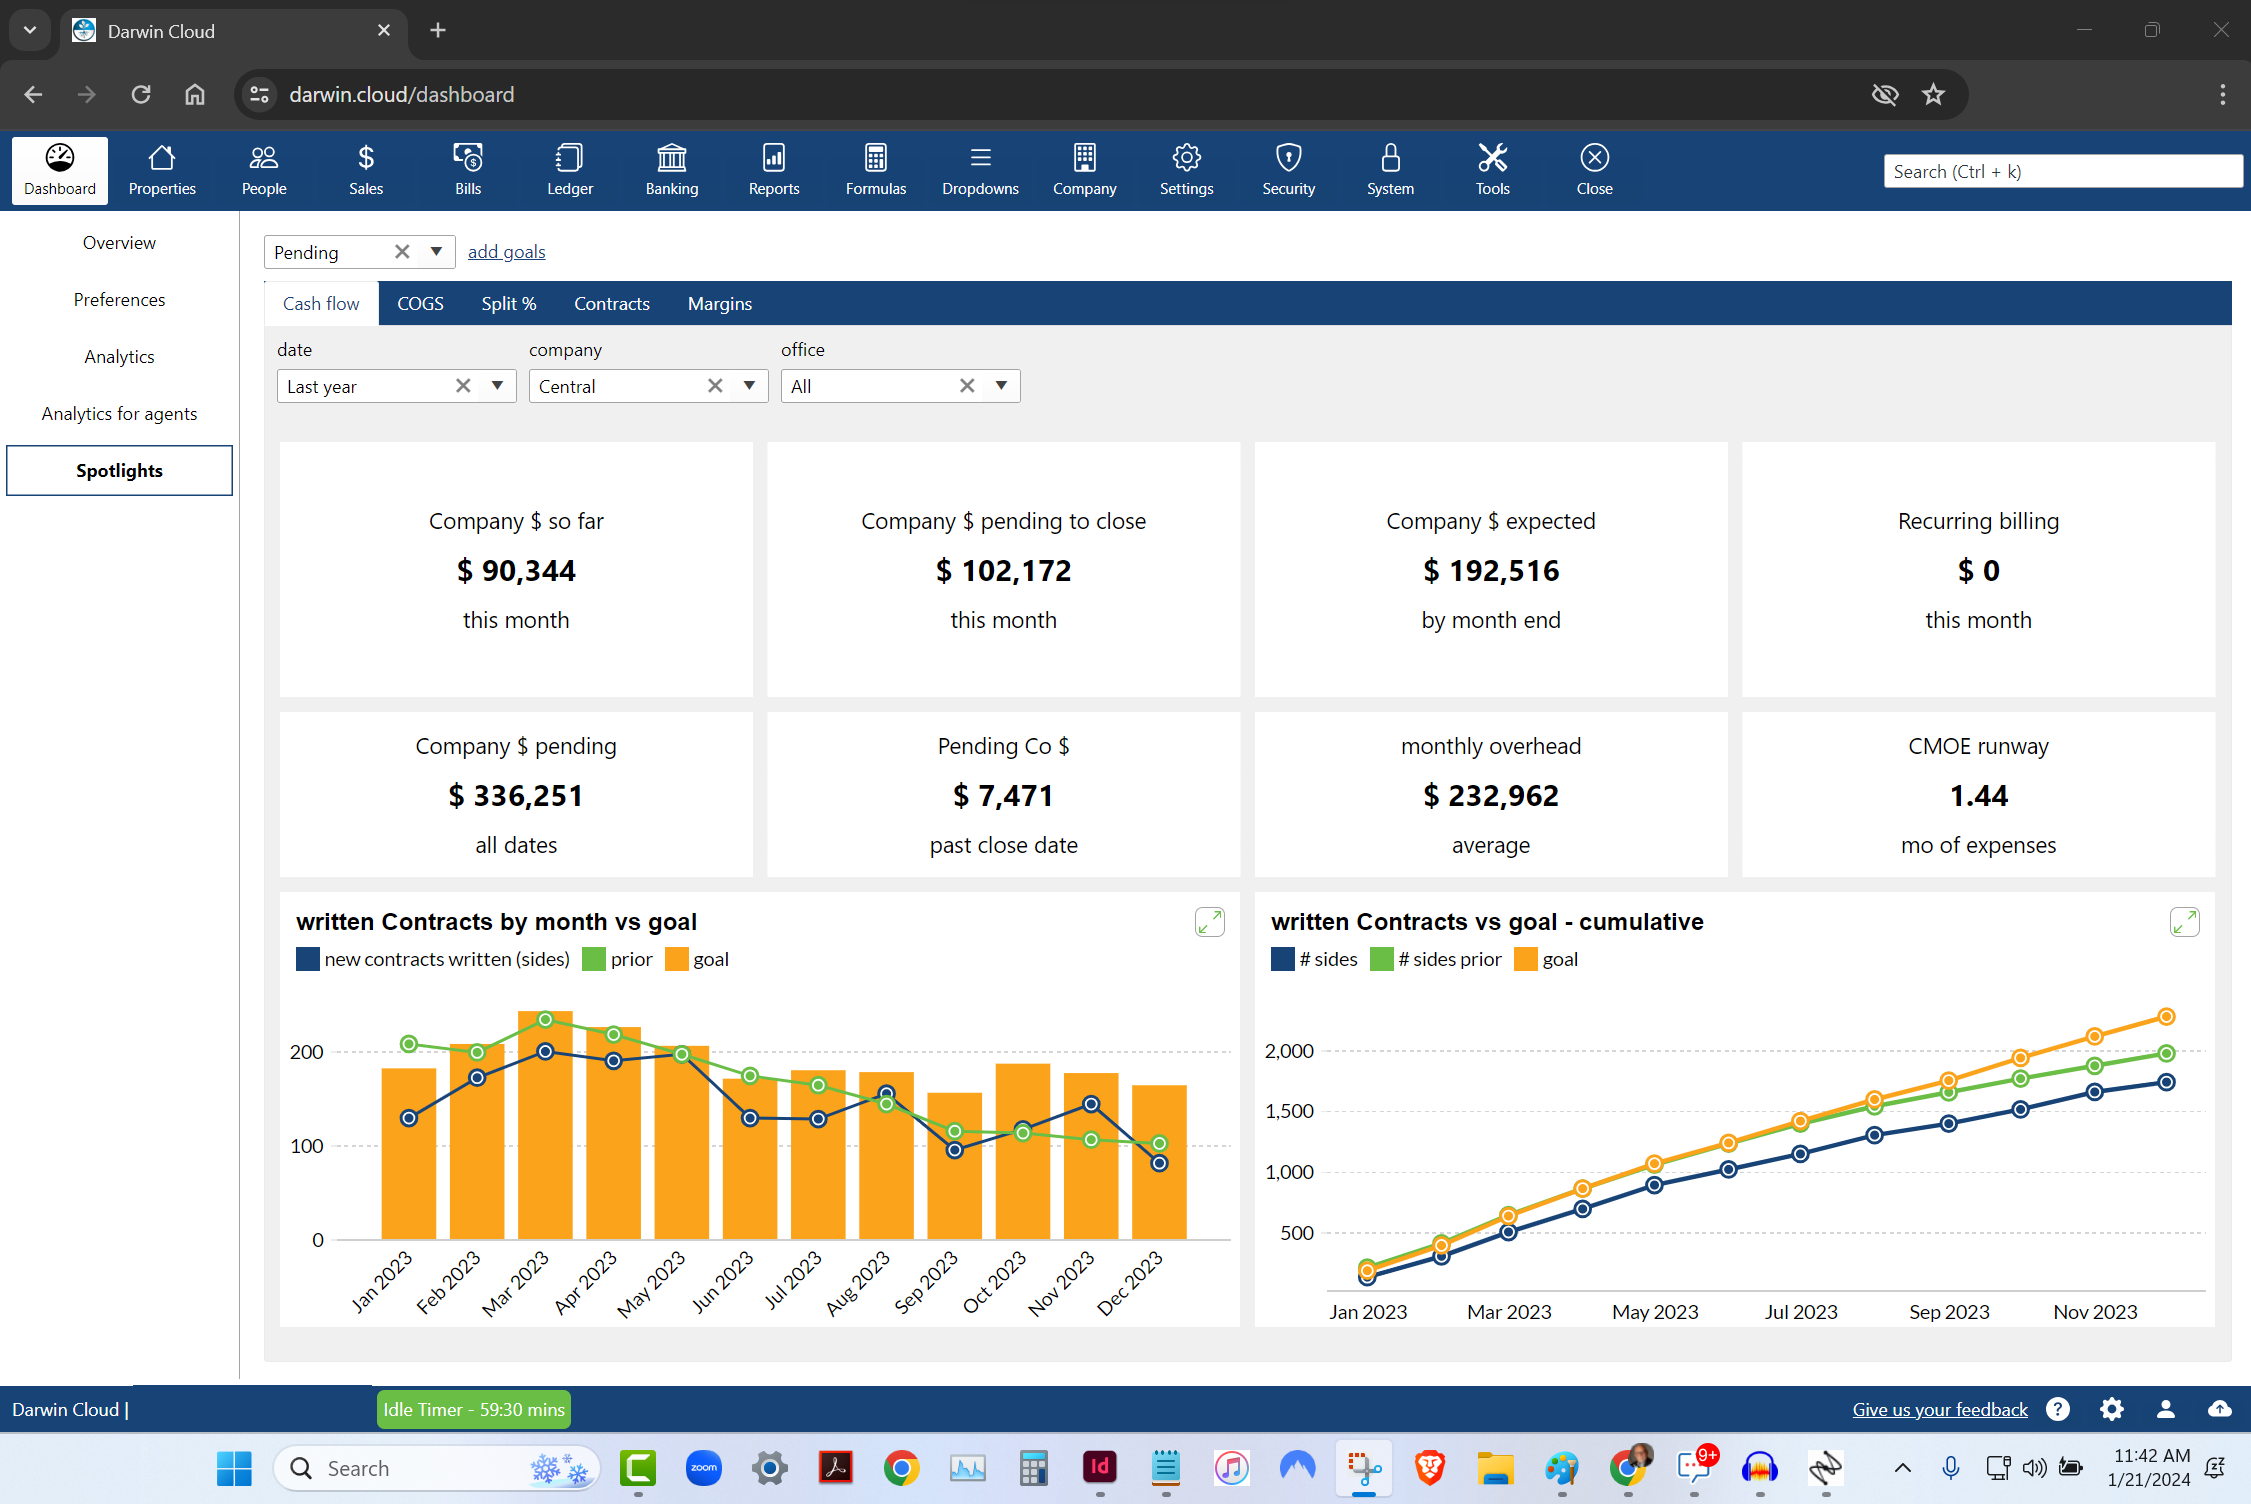
Spotlight KPI: Pending cash flow
KPI Spotlight: cash flow. Spotlights are the newest and best way to see how your company is performing. Using a collection of key performance metrics, you can quickly get to critical information that drives your company's success.

Behind the scenes: EOS analytic Spotlights
While working together to finish darwin.Cloud, Mark Blagden, CEO of AccountTECH and Helkyn Coello, VP OF Development recorded a series on conversations about the design & building of darwin.Cloud. This is their conversation about: EOS style scorecards and Analytic Spotlights

NEW tools in darwin.Cloud for Agents
There's alot for Agents in the new darwin.Cloud. Some of the tools are help the agent's be more successful. Some of the tools are to help Sales managers help the agents. And other tools are designed to save the back office and accounting staff time.

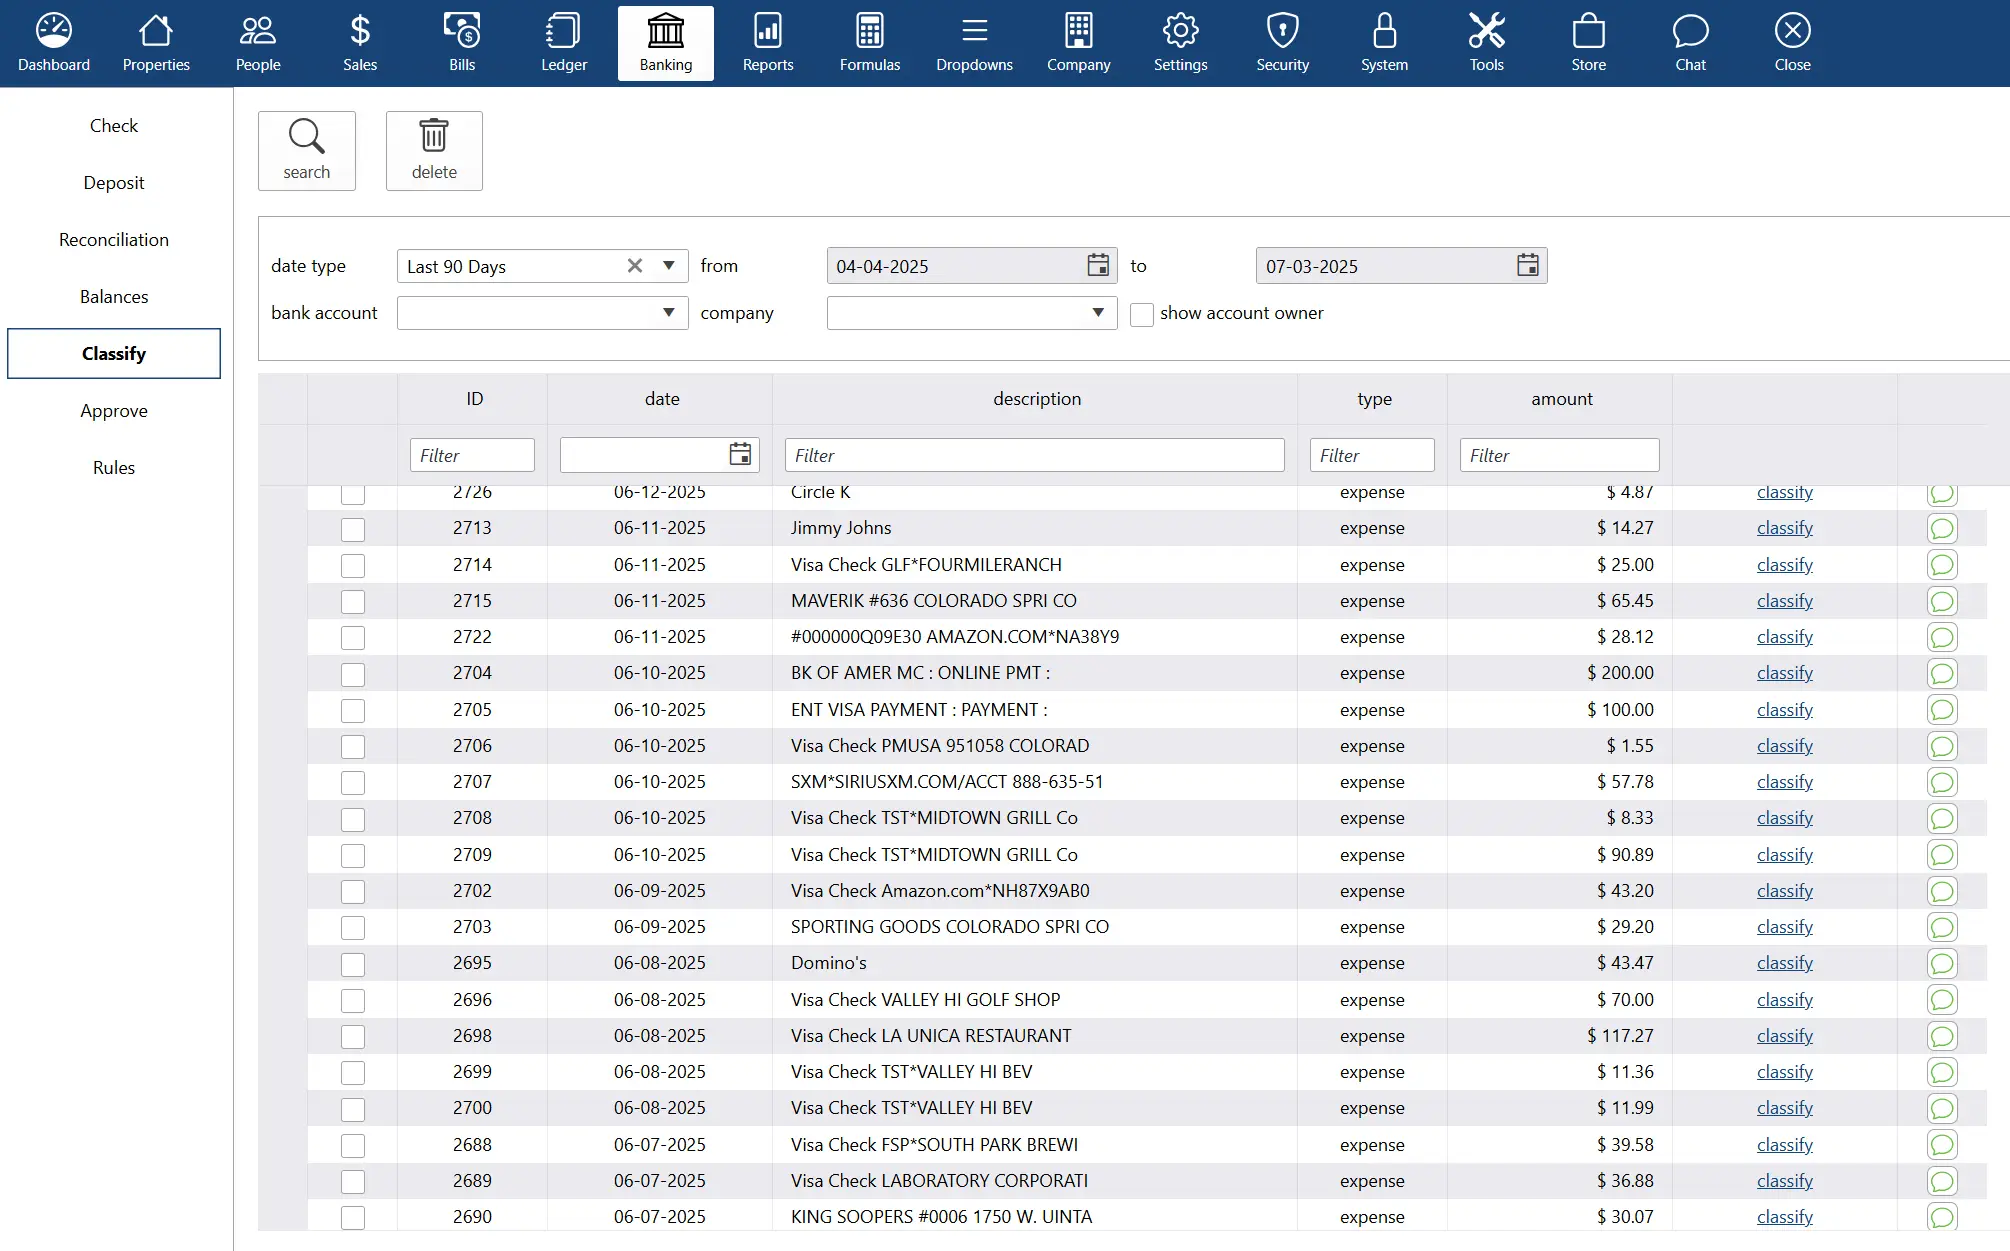
NEW darwin.Cloud feature: Create rules to charge incoming expenses to a group of offices
darwin.Cloud now has enhanced automation that enables you to more accurately allocate expenses that stream into darwin daily.

NEW darwin.Cloud feature: Create complex rules for expense classification automation across multiple offices and GL accounts
Create complex rules that enable darwin correctly allocate bank & credit card charges.

NEW darwin.Cloud feature: Connect your credit cards to darwin.Cloud
Connect your credit cards to darwin.Cloud so you can have darwin automatically classify your credit card charges.
NEW darwin.Cloud feature: Agents print their own 1099
Agents can print their own 1099 for this year - and any prior years ! Now the staff is free from the burden of printing, stuffing envelopes & mailing 1099s to agent
NEW darwin.Cloud feature: Setup Agent Goals
Its time to set agent's goals for the new year with the tools in darwin.Cloud

Behind the scenes: Bank Stream
While working together to finish darwin.Cloud, Mark Blagden, CEO of AccountTECH and Helkyn Coello, VP OF Development recorded a series on conversations about the design & building of darwin.Cloud. This is their conversation about: streaming Bank account & Credit card data

Quickbooks replacement tech part 2: expense allocation
darwin.Cloud automatically allocates incoming payments across all your offices.

Quickbooks replacement tech part 1: streaming bank data
darwin.Cloud now has enhanced automation that streams bank and credit card activity into darwin. This technology saves time & enables you to much more accurately classify payments that stream into darwin daily.
NEW darwin.Cloud feature: Company Store
darwin.Cloud now includes your Company Store

darwin.Cloud Profit per Agent - it's more than just commission split
Profit per agent is just commission split ... it's what's left after expenses
NEW darwin.Cloud feature: Automatic Bank reconciliations
darwin.Cloud now includes automatic bank reconciliation.

NEW darwin.Cloud feature: Enhanced Accounting summary screen
In darwin.Cloud, see every accounting entry that has any connection to your real estate transaction - all in one place

NEW darwin.Cloud feature: Reclassify Journal entries without unposting
With darwin.Cloud, it’s easy to fix Journal entries that were entered incorrectly.
NEW darwin.Cloud feature: Import your bills from Excel
Save a lot of time each month by entering your bills into darwin.Cloud using Excel import

NEW darwin.Cloud feature: Import Credit card charges
Now, you can import your Credit card expenses into darwin.Cloud.

NEW darwin.Cloud feature: Import payroll
Now, you can import your payroll expenses into darwin.Cloud.
NEW darwin.Cloud feature: Quick fix check numbers on Agent or Commission payments
In darwin.Cloud, you can now add the missing check numbers without having unpost or re-do any of your work

NEW darwin.Cloud feature: Store deposit receipts online
Store copies of your deposit receipts online.

NEW darwin.Cloud feature: automatically pay off agents bills when closing
darwin.Cloud has a tool to make it fast and easy, when you withhold agent bills from their commission, to apply this credit automatically.

NEW darwin.Cloud feature: Reclassify invoices
With darwin.Cloud, it’s easy to fix agent billing that was put to the wrong gl account. You don’t have to create complex adjusting journal entries. You don’t need to Unpost or UnReconcile invoices and payments.
Even if an invoice is already paid - and even if the payment has cleared the bank - you can fix the expense categorization on the original invoice.

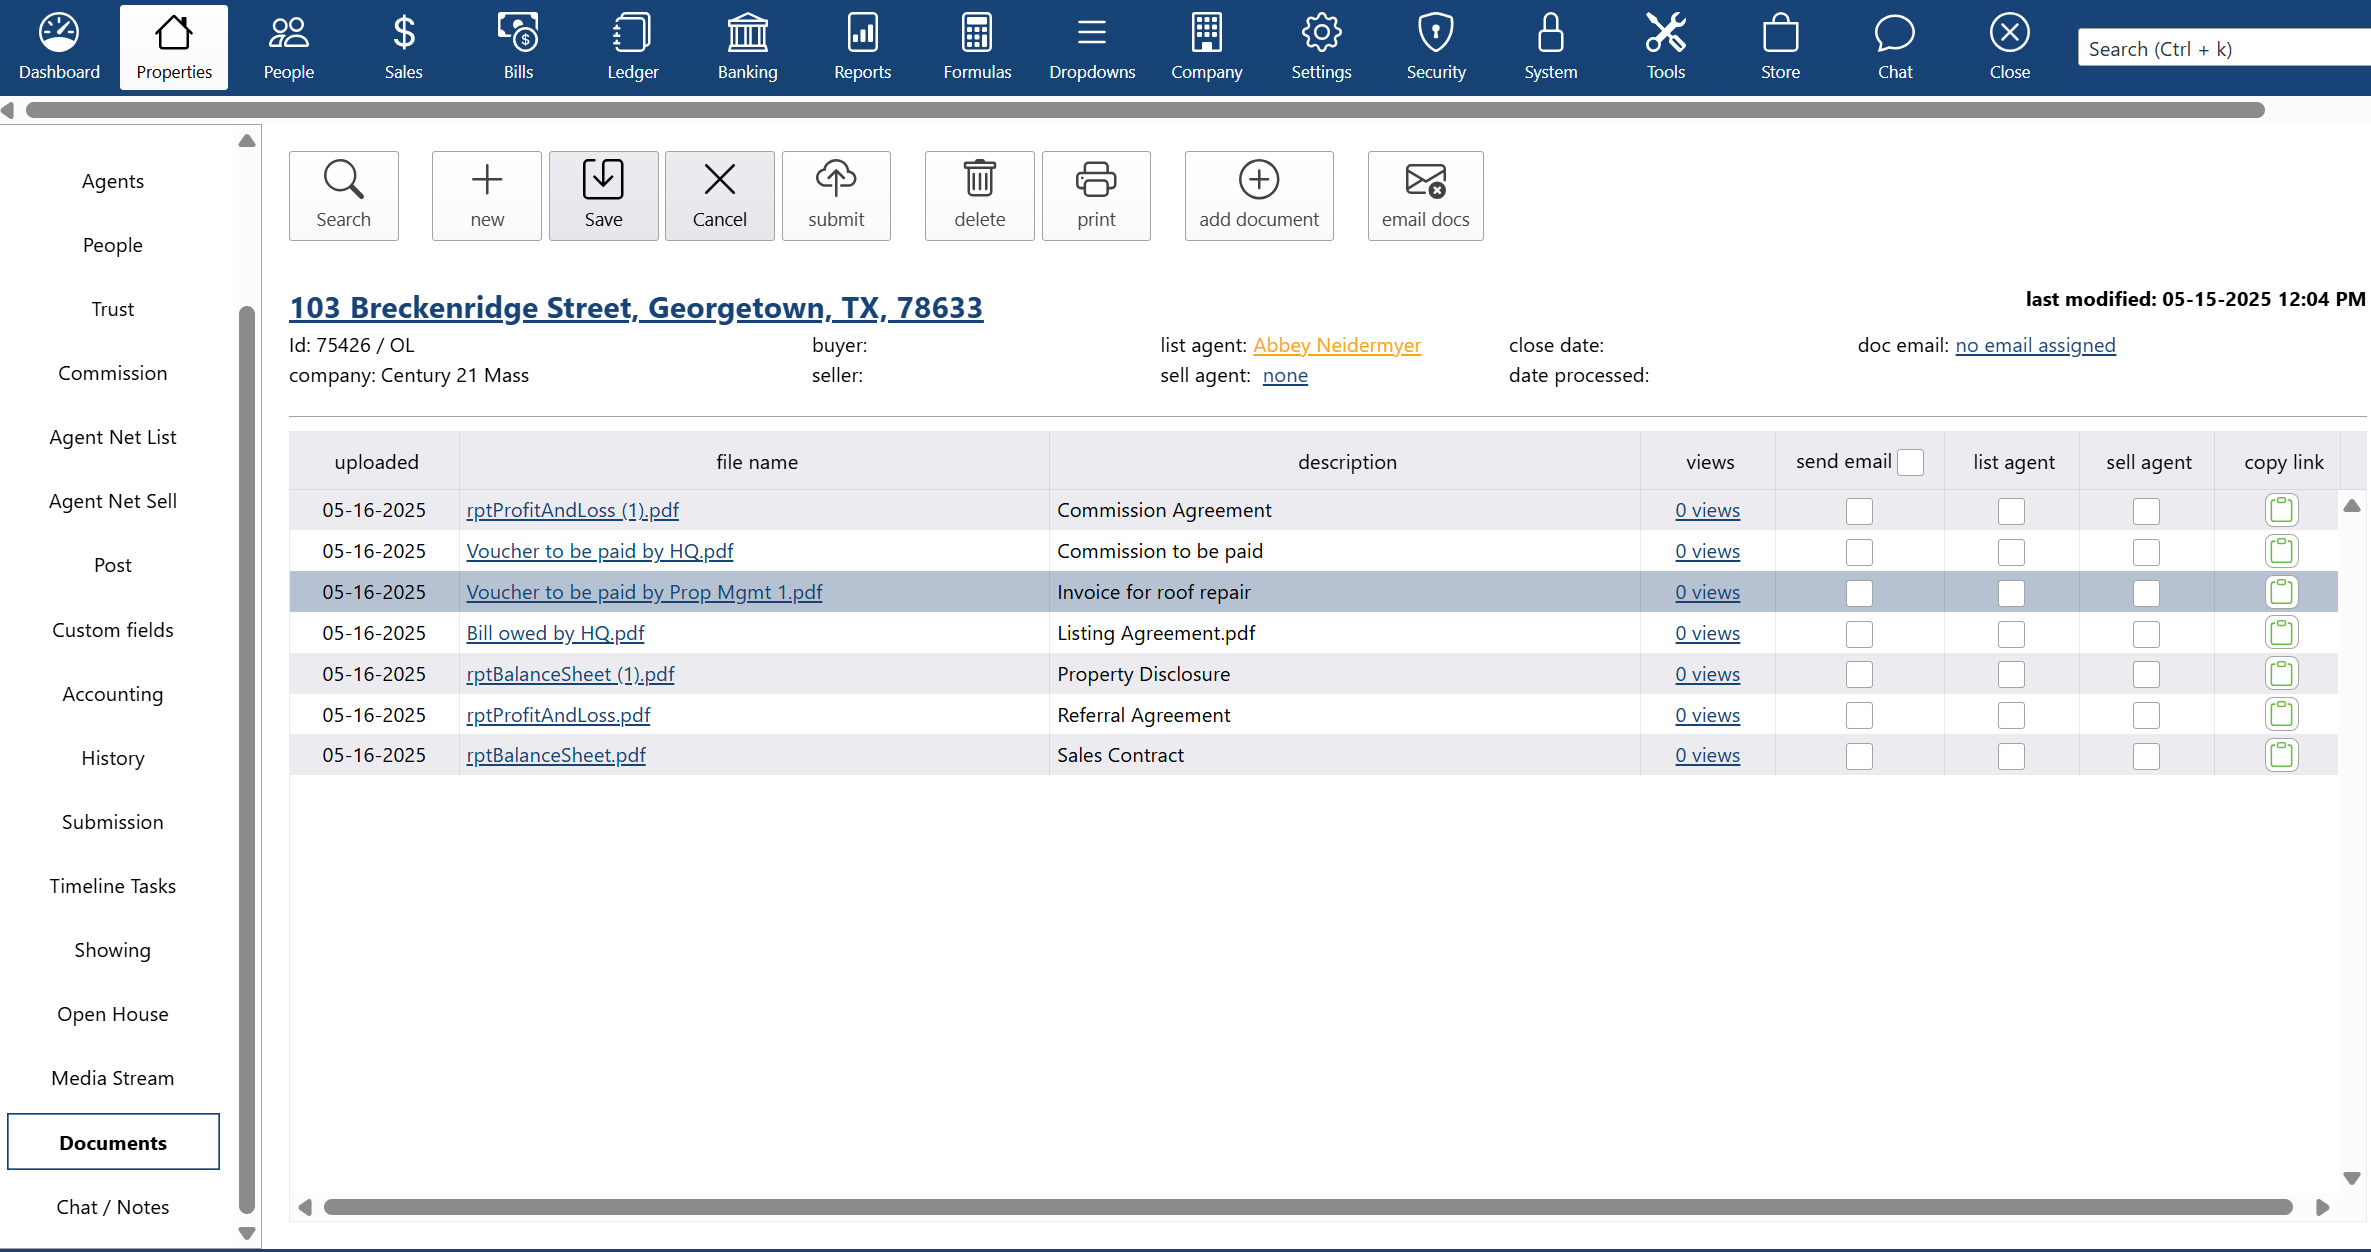
New darwin.Cloud feature: Store agent billing documents online
darwin.Cloud lets you store documents related to agent billing
The uploaded documents are stored on the invoice screen and attached to your agent bills.
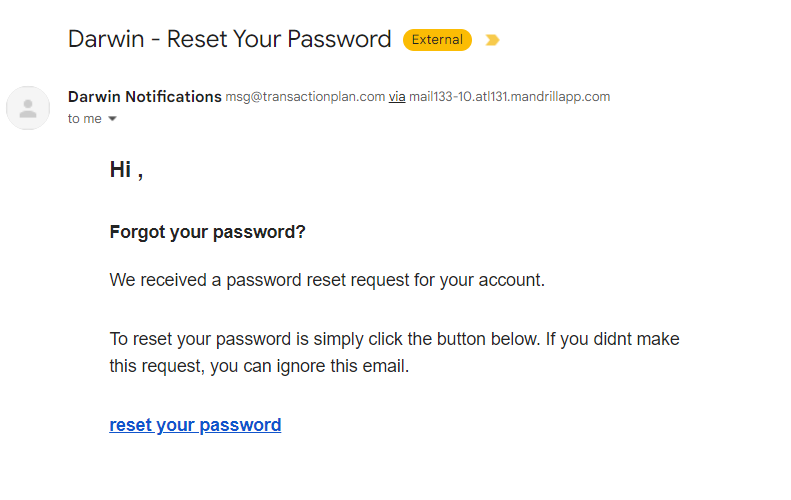
New darwin.Cloud feature: Agent password recovery
Now, it’s easy for agents to recover / reset their own password for darwin.Cloud.
the Evolution of darwin is darwin.Cloud
All the features and functionality of TransactionPlan.com and darwin Citrix are being combined into a single, unified platform that is 100% web based and secured without the need for Citrix.

New darwin.Cloud feature: Recover Expenses from agents
darwin.Cloud makes it easy to recover expenses from agents while paying your bills
Sometimes it happens that a bill comes into your office, and the charges on the bill need to be reimbursed from one (or all) of your agents. darwin has a tool to do this for you.

New darwin.Cloud feature: Divide Expenses across all offices
darwin.Cloud makes it easy to spread expenses across all your offices.
Whether you have two offices or two hundred offices. You know that equitably and accurately spreading expenses correctly across all your offices is the only way to get an accurate picture of the true profitability of each location.
New darwin.Cloud feature: context aware help in app
darwin.Cloud has context aware help built right into the app. Now, from any screen in the software, you can get articles, tips & training videos - all related to the page you are currently working with.
NEW: darwin.Cloud 2 factor login without Citrix
Now, when users log into darwin.Cloud, they won't use Citrix. They won't even need to have Citrix security software installed on their computer.

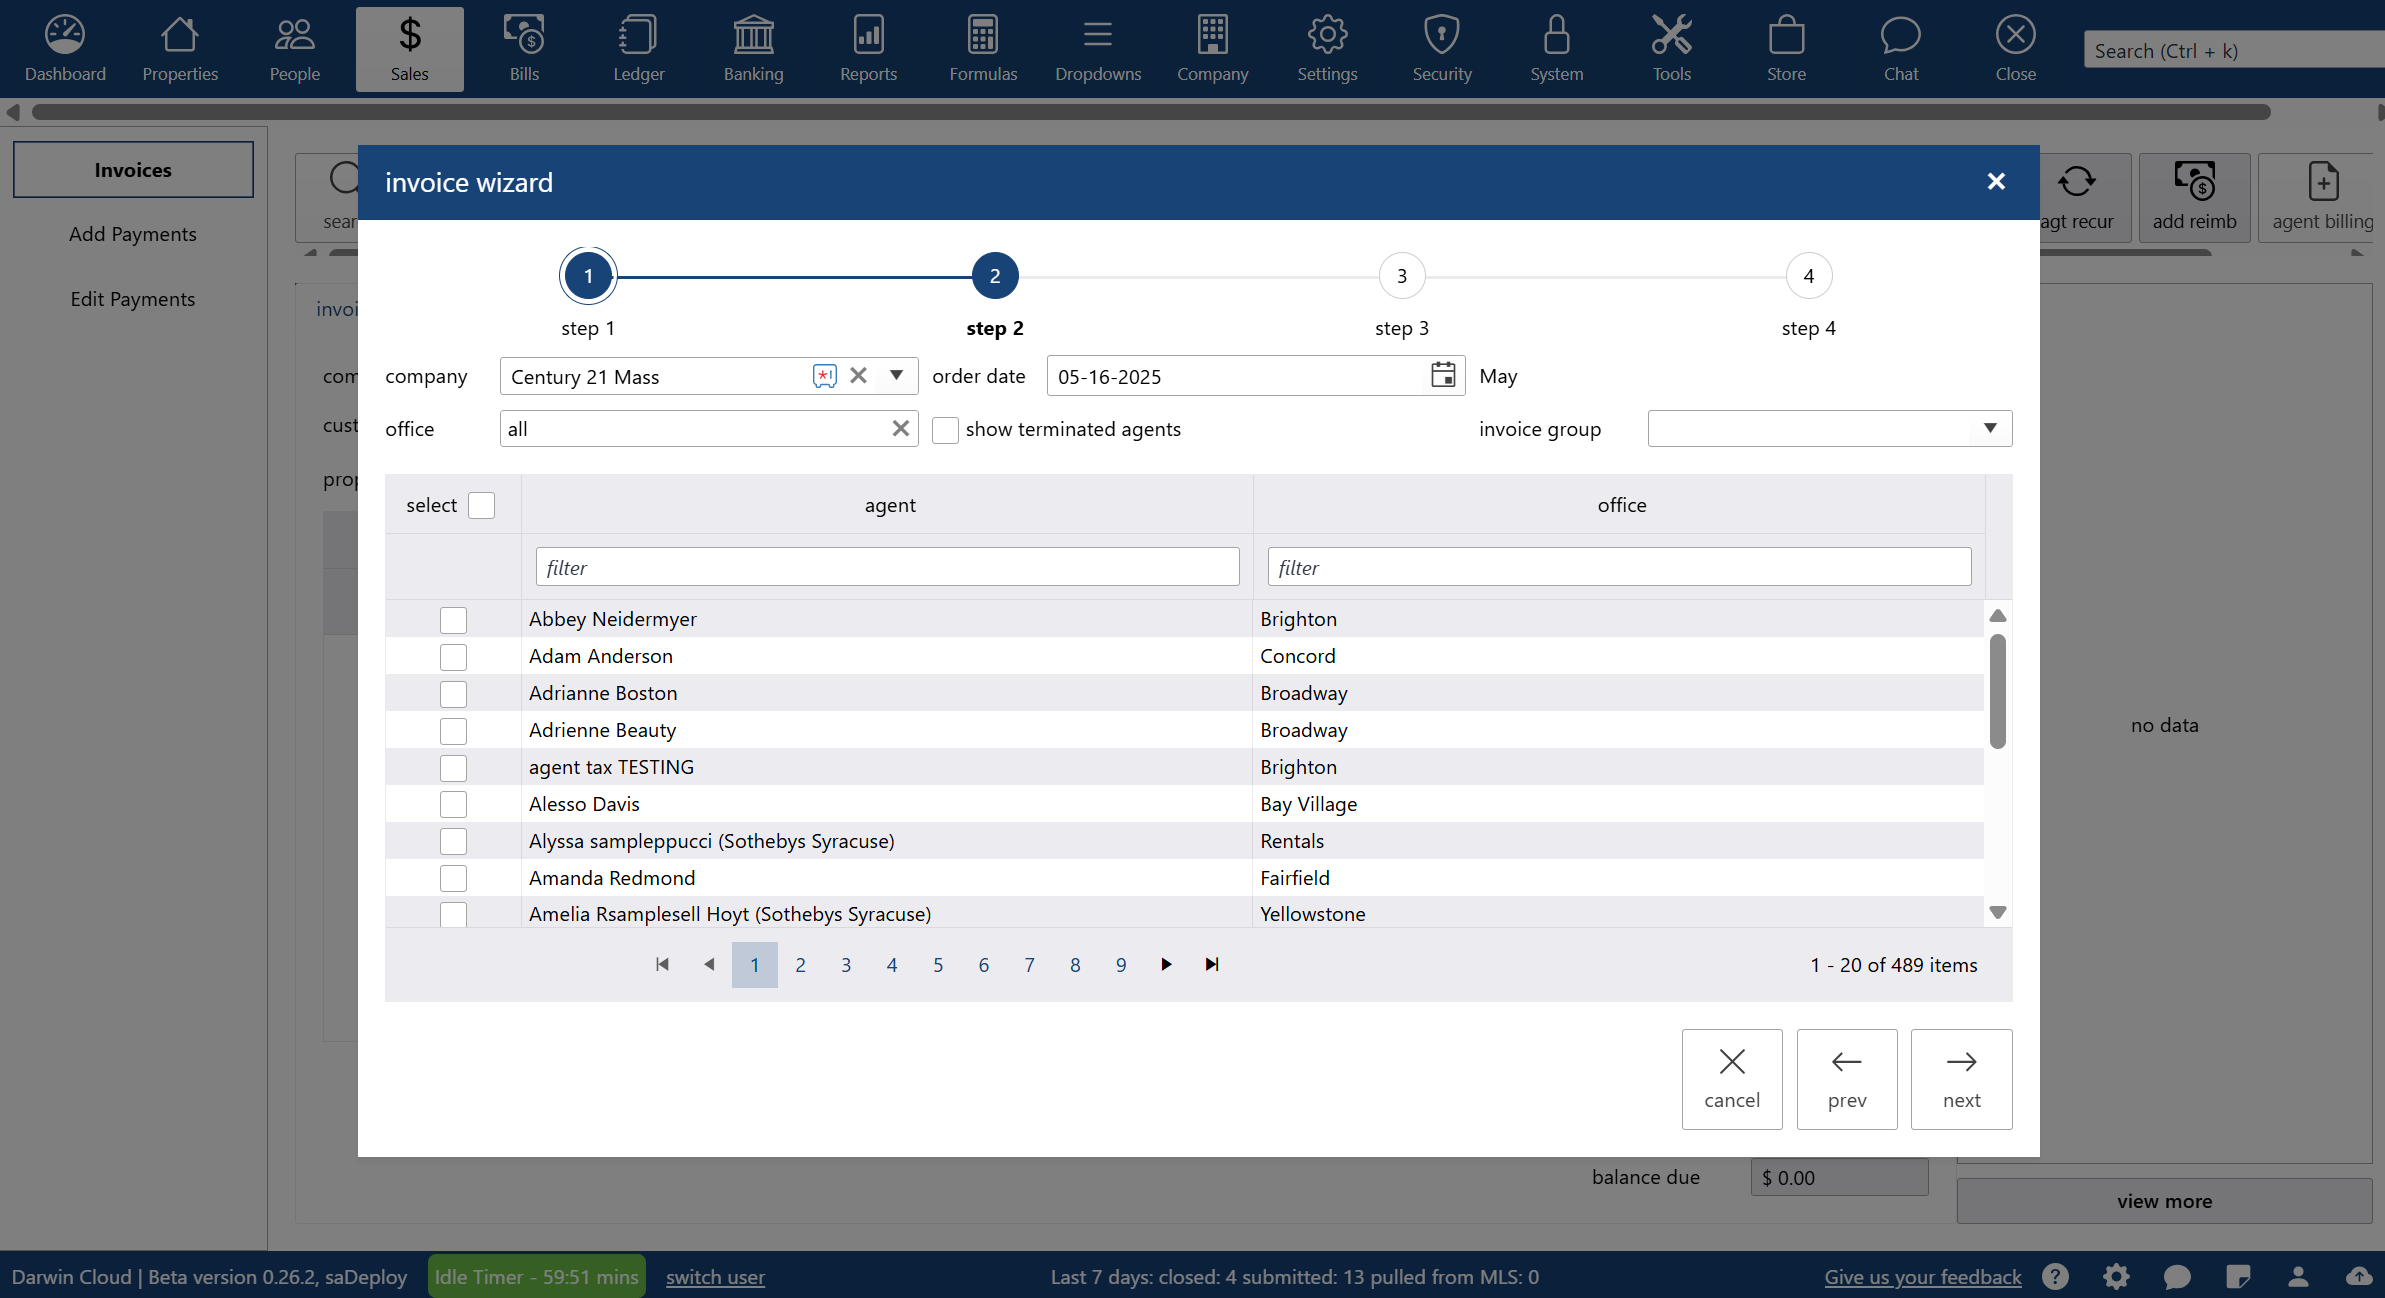
NEW darwin.Cloud: Super fast Agent billing
Agent billing in darwin.Cloud is fast … really fast.
The Agent billing wizard in darwin.Cloud has been updated and has a new look and turbo-charged for speed. In this video we are going to take a look at the updates to the screens of the wizard. Then, we are going to run a large batch of agent invoices - with a stop watch running.
NEW darwin.Cloud feature: Link suppliers to Journal entries for credit card
darwin.Cloud has new features for tracking purchases from Suppliers that are paid by credit card.
It solves this problem: How do you record Journal entries to classify credit card expenses - and still track purchases by supplier ?

NEW darwin.Cloud feature: Move a Property pre-payment deposited incorrectly
In darwin.Cloud, there’s a new tool to correct a commission pre-payment that was applied incorrectly.
It solves this problem: What do you do when you have received a commission payment in advance - but the payment was recorded on the wrong house ?

NEW darwin.Cloud feature: Run Last Launched report
On the reports screen in darwin dot cloud, there's a tool that you'll find yourself using all the time. It's called: Run last launched report. This tool is especially helpful when you're designing custom reports.
The benefit of this tool is that it remember the last report you looked at.
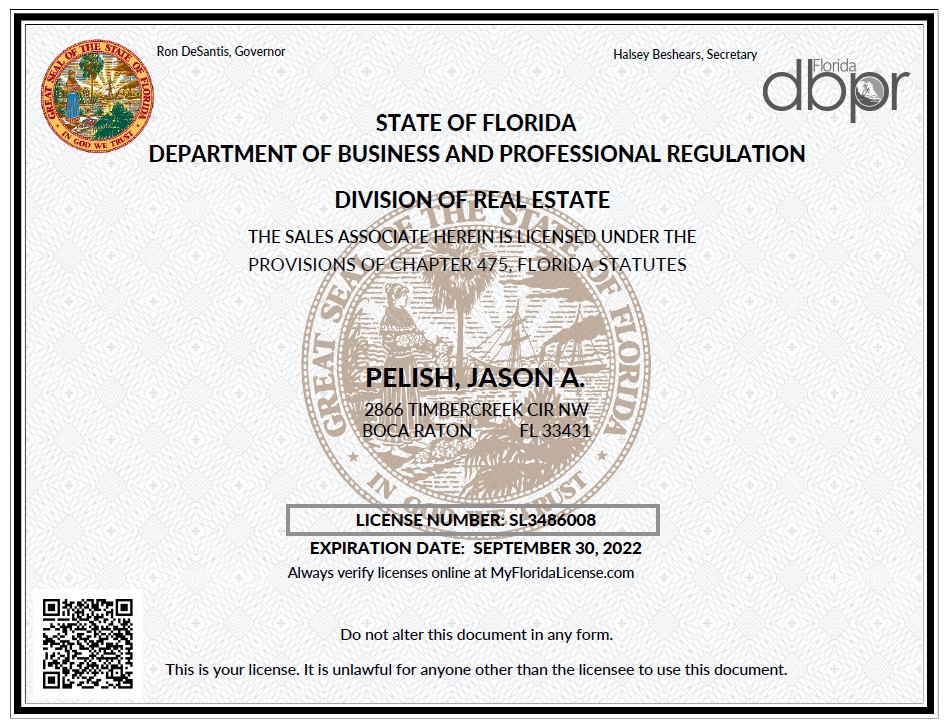
NEW darwin.Cloud feature: Agent license status warnings
When you're working with a property in darwin.Cloud, there is an easy way to see when an agent's license is expired.

NEW darwin.Cloud feature: Record commission deposits in advance
When a Commission deposit comes in before you're ready to close a property, darwin.Cloud has new features that make it easy to record the deposit ... and simultaneously, make the deposit visible to everyone on staff ...

NEW darwin.Cloud feature: Billing groups
darwin.Cloud has a new feature for splitting bills: Billing groups. It makes it really fast to take a bill, put it in darwin, and divide it across lots of your offices... automatically.
Top 10 tips for an efficient closing department - Tip 4: Closers shouldn't make deposits
In fact, most of the Top 10 closing departments don’t have the closing department staff do anything with deposits except double check that they were done and recorded correctly.
NEW darwin.Cloud feature: Reclassify expenses
With darwin.Cloud, it’s easy to fix a bill put to the wrong expense account. You don’t have to create complex adjusting journal entries. You don’t need to Unpost or UnReconcile bills and payments.
Even if a bill is already paid - and even if the payment has cleared the bank - you can fix the expense categorization on the original bill.