accounttech research: profitability is spreading across real estate brokerages
fewer firms are losing money — and more are reaching sustainable ebitda ranges. today accounttech released new industry research analyzing the distribution of ebitda performance across real estate brokerages, revealing a decisive shift in industry financial health over the past three years.
drawing on summarized benchmark data spanning 2023 through 2025, the research shows that profitability is no longer confined to a small number of top tier firms. instead, brokerages across the industry are migrating out of deep-loss positions and into stable (though often modest), positive ebitda ranges.
headline findings from the research
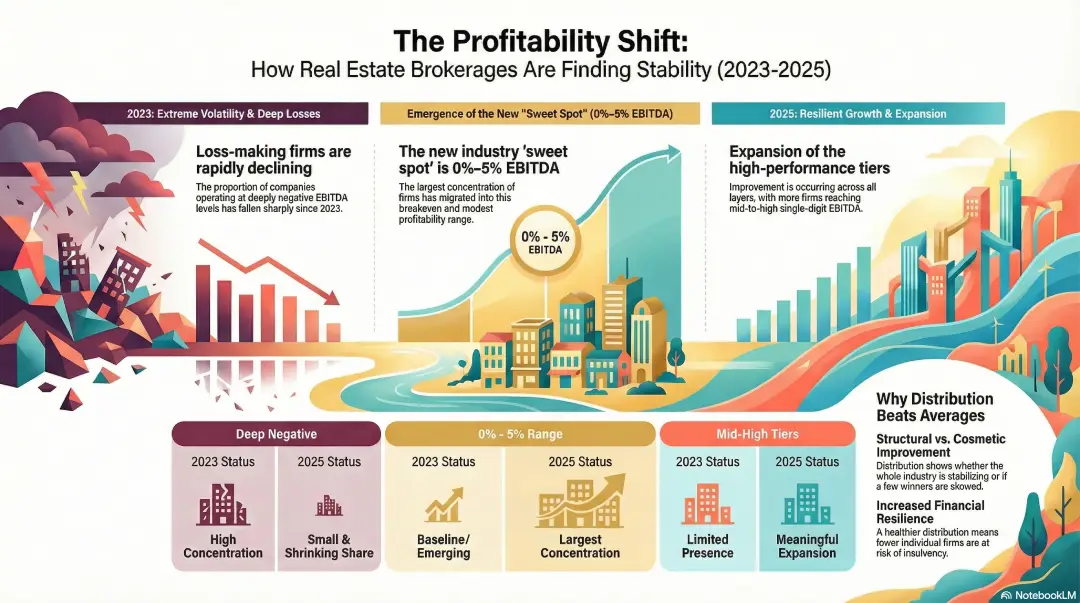
loss-making firms are rapidly declining
the proportion of companies operating at deeply negative ebitda levels has fallen sharply year over year. the lowest ebitda bands now represent a small and shrinking share of the industry, compared to just two years ago.
the industry is consolidating around positive ebitda
the largest concentration of firms now sits in the 0%–5% ebitda range, indicating widespread movement toward breakeven and modest profitability rather than volatility or extreme outcomes.
higher-performing ebitda bands are expanding
the percentage of companies achieving mid-to-high single digit ebitda has increased meaningfully, while the top ebitda tiers have also grown — signaling that financial improvement is occurring across multiple layers of the market.
“this is not a story about a few winners pulling away,” said the accounttech ceo, mark blagden. “it’s a story about systemic improvement, where fewer firms are losing money and more firms are achieving sustainable profitability.”
ebitda distribution: visual summary
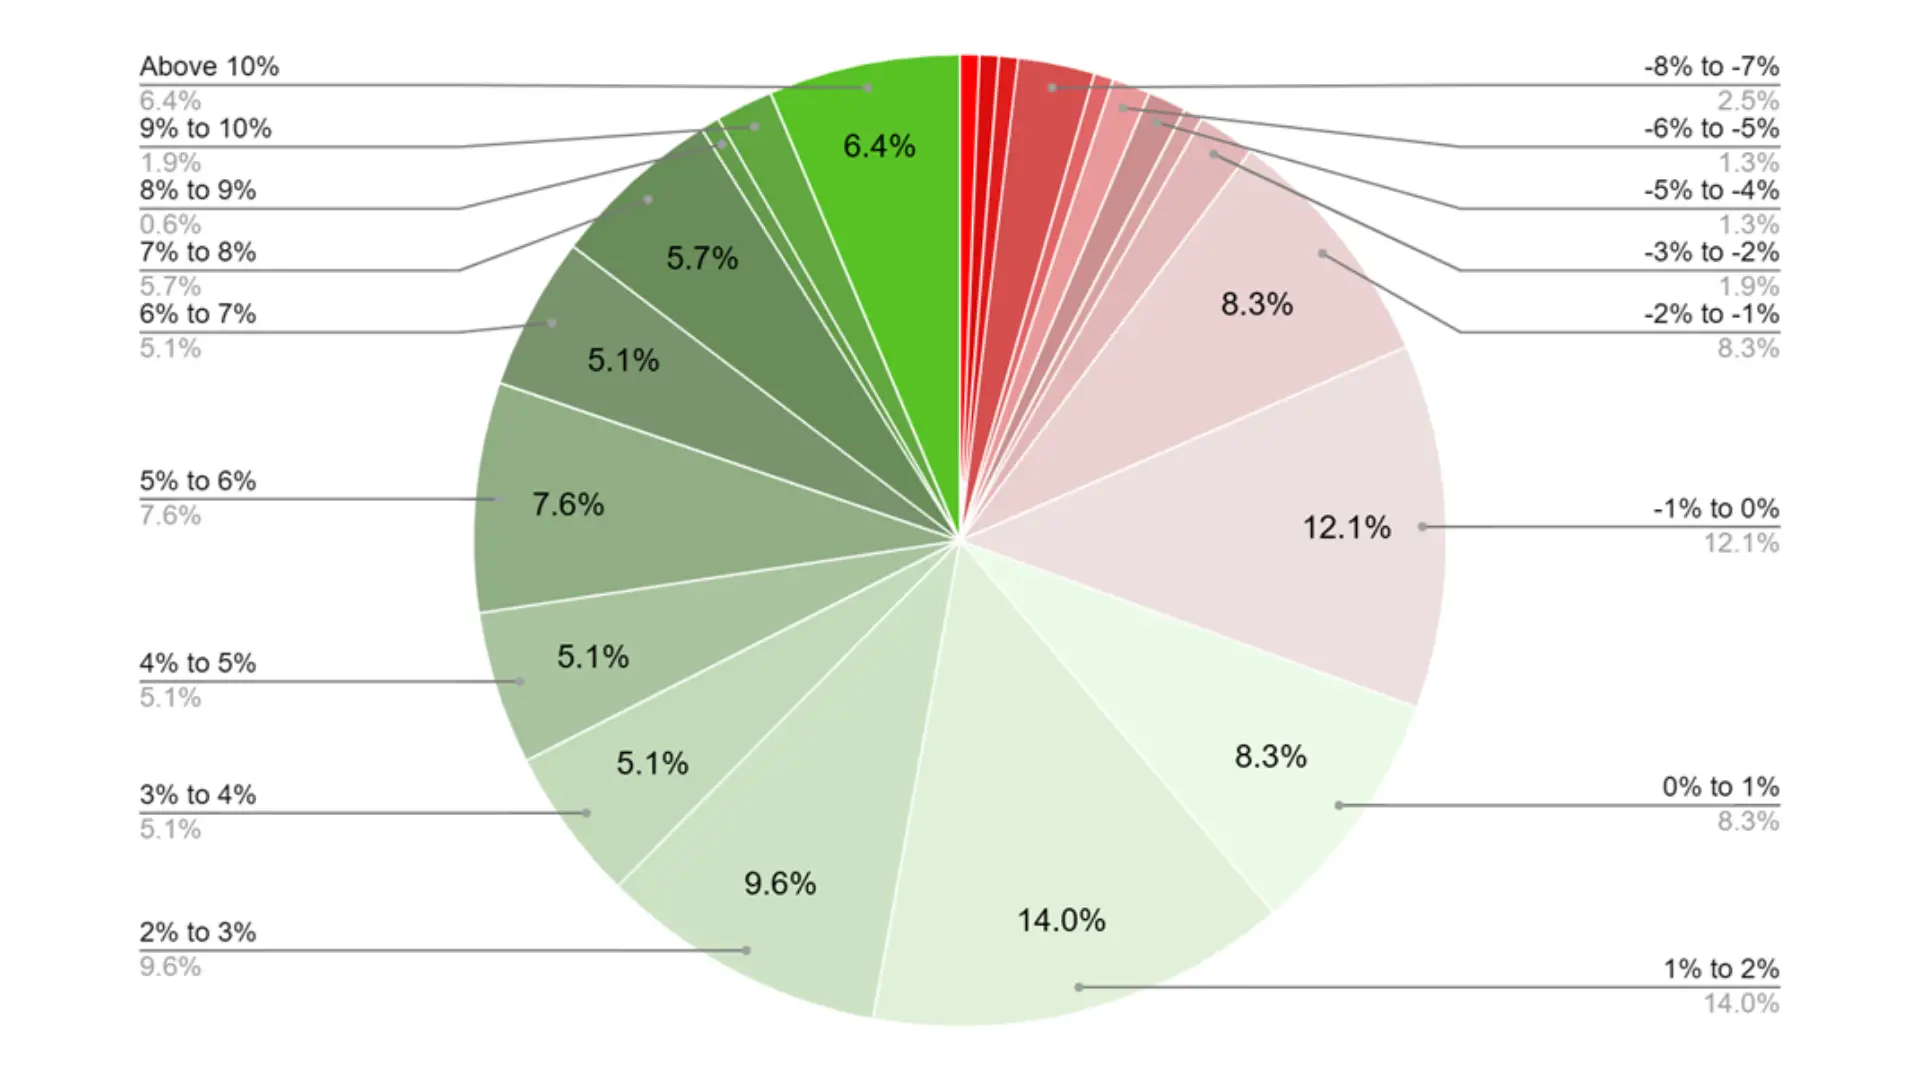
figure 1. ebitda distribution by margin band (2023)
this infographic shows the full distribution of brokerage ebitda margins for 2023, segmented by discrete margin bands. it establishes the baseline year, highlighting the concentration of firms in negative and near-breakeven ranges at that point in time.
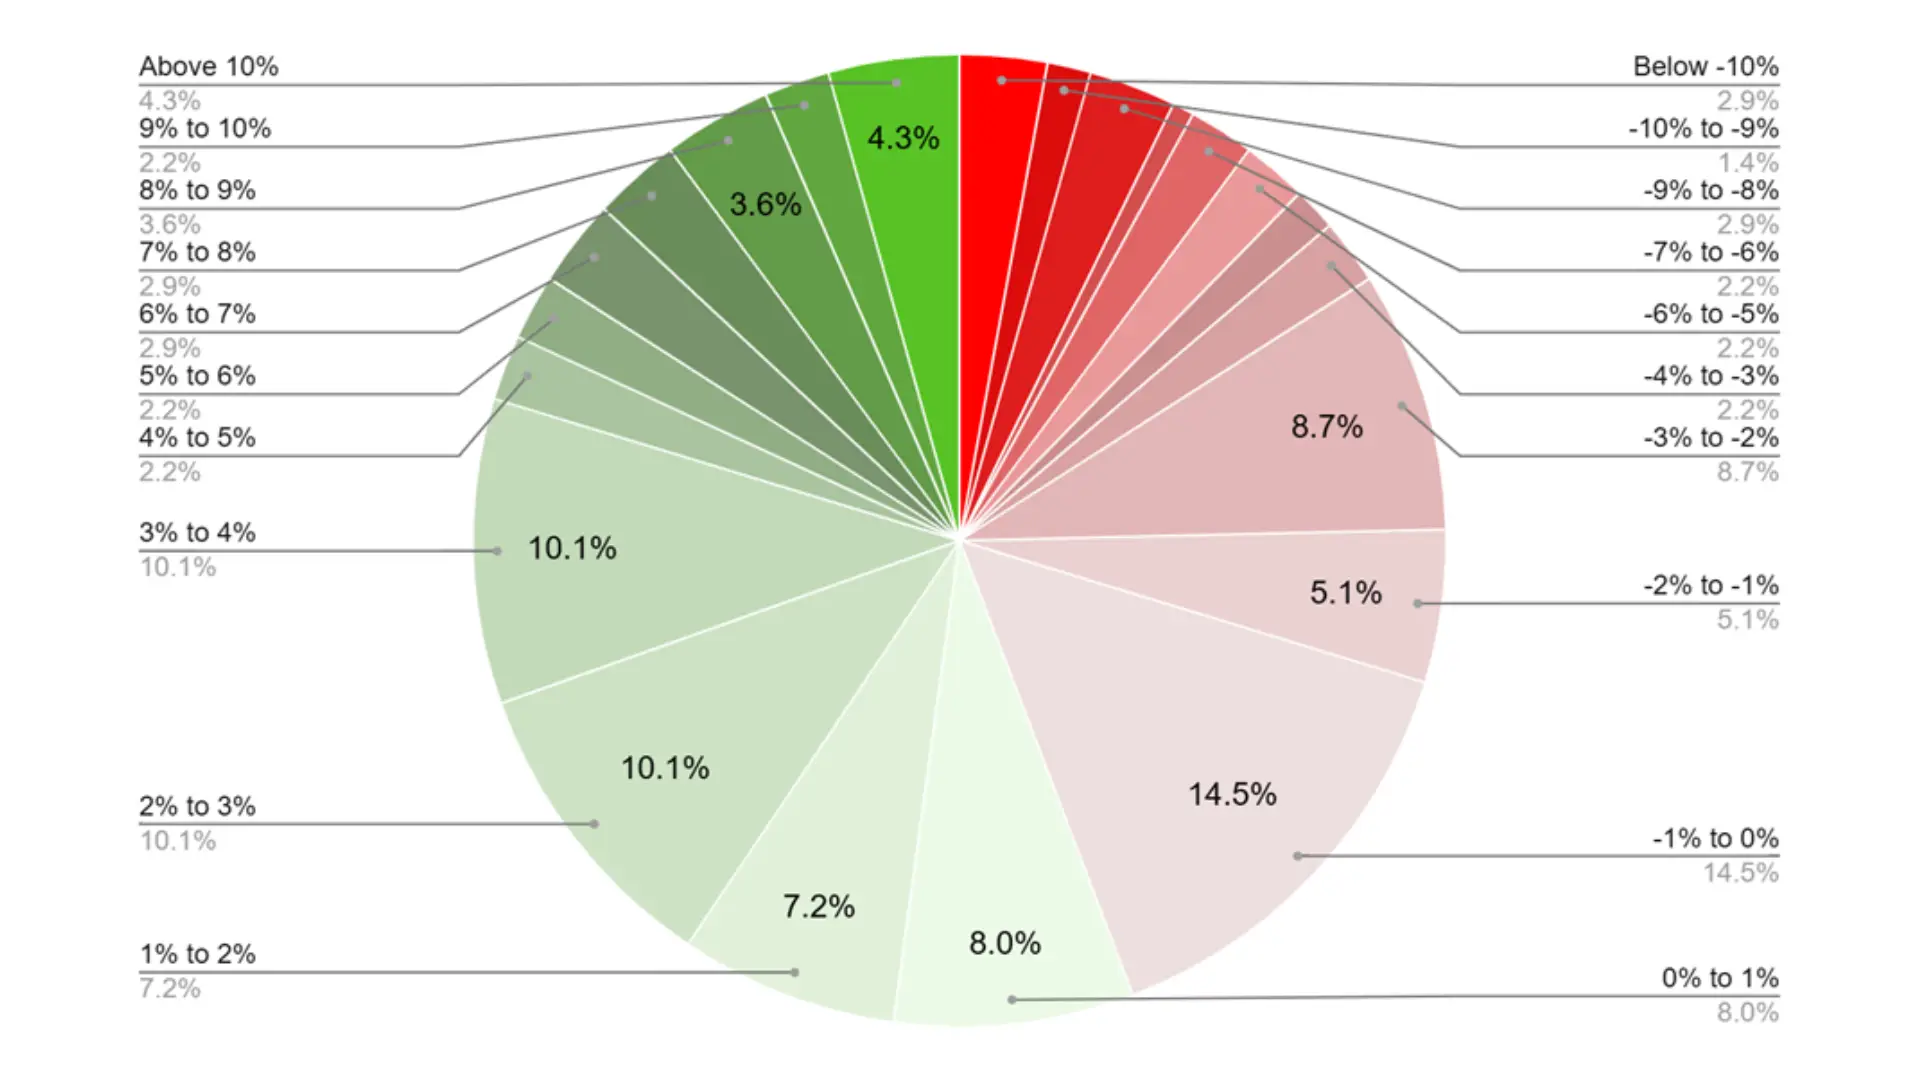
figure 2. ebitda distribution by margin band (2024)
this infographic illustrates the 2024 distribution and makes visible the initial contraction of deep-loss bands alongside early expansion in breakeven and low-positive ebitda ranges.
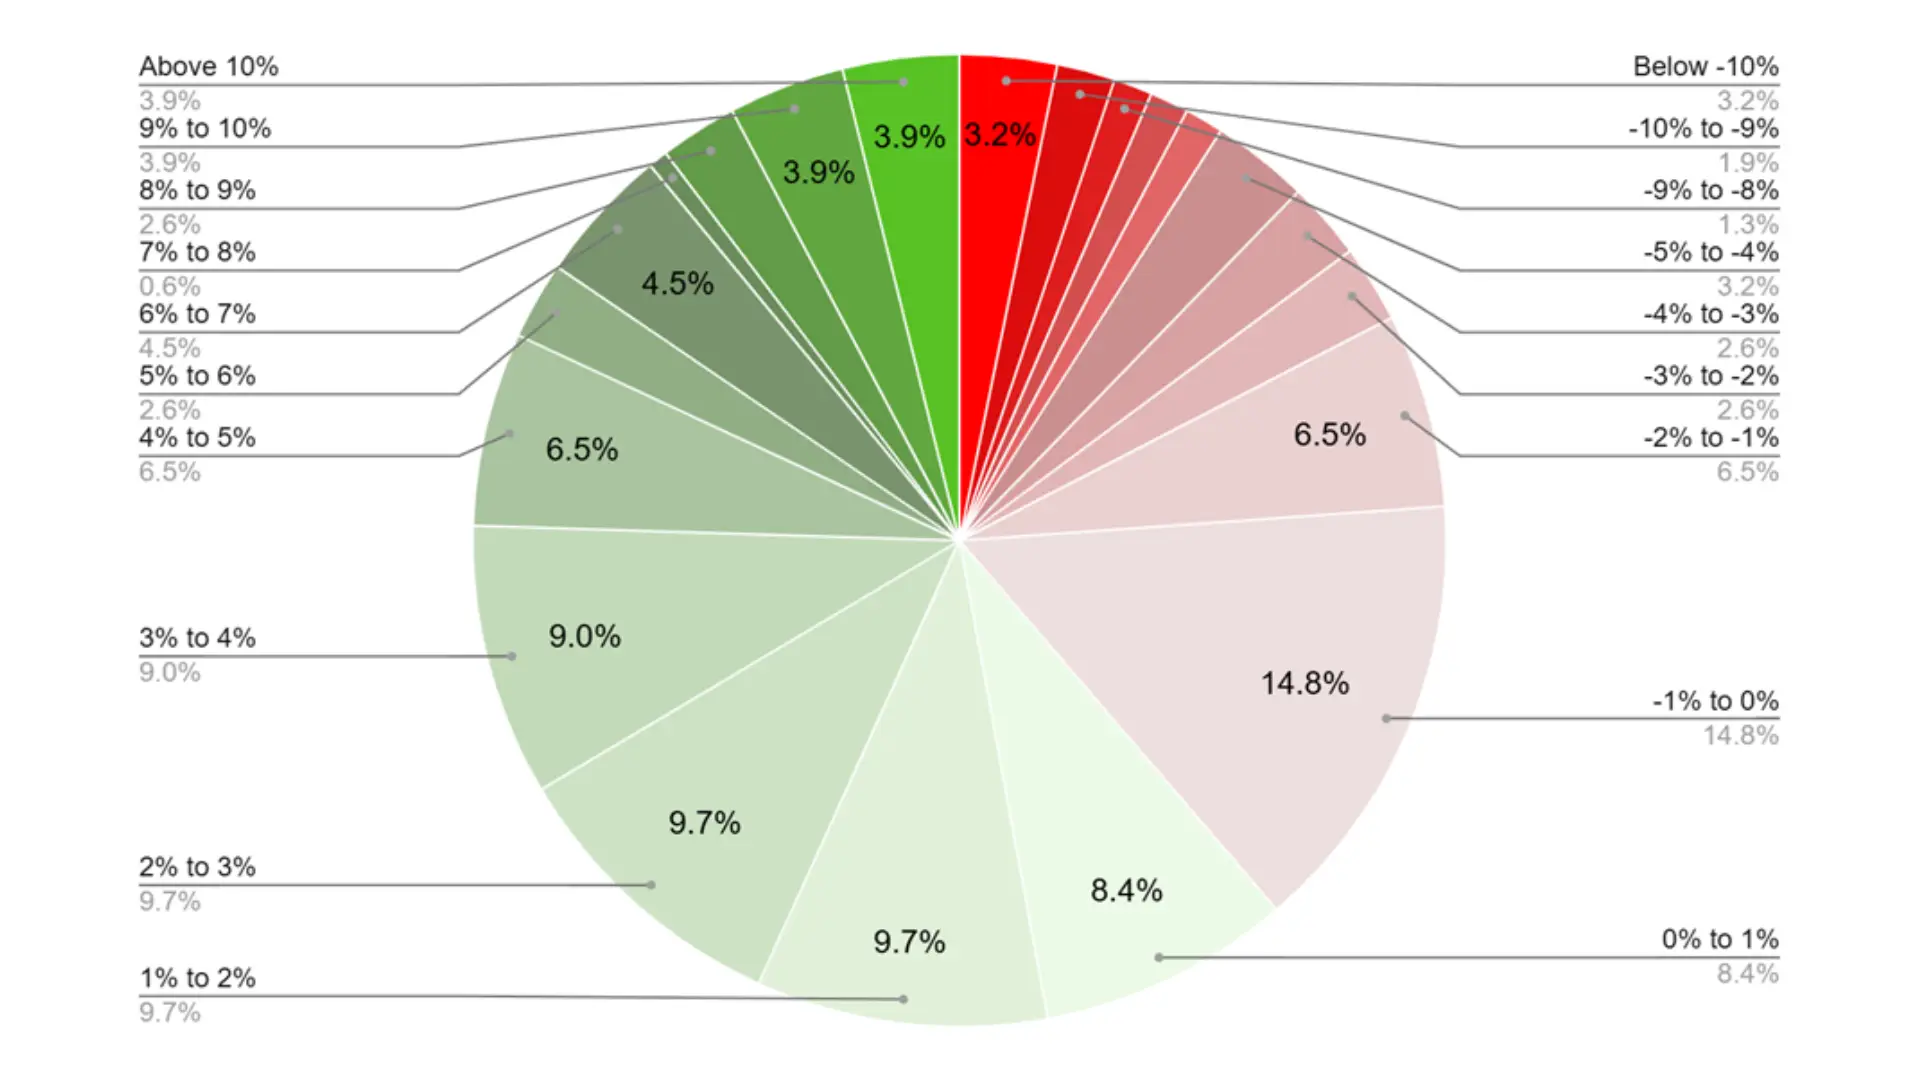
figure 3. ebitda distribution by margin band (2025)
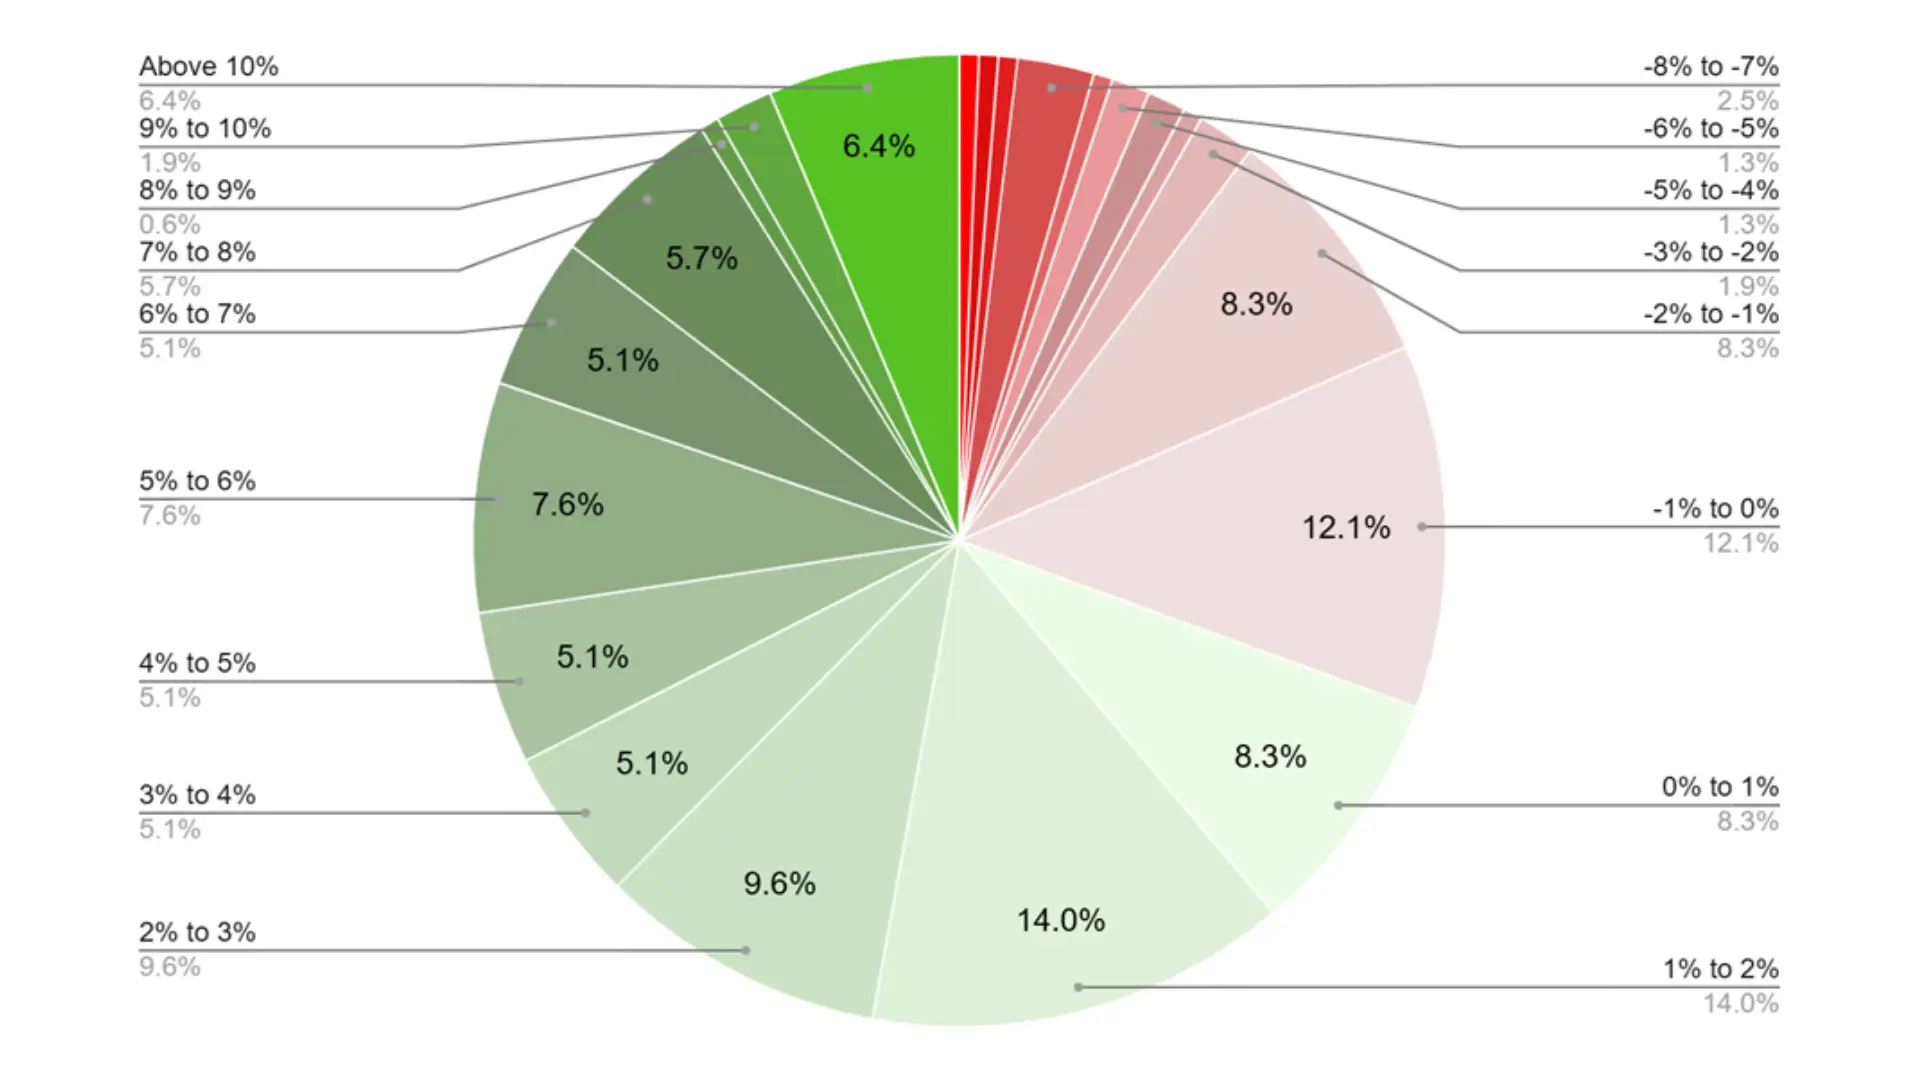
this infographic shows the 2025 distribution, clearly demonstrating the structural shift away from deep negative ebitda and toward sustainable positive operating ranges.
together, these visuals highlight movement across the entire distribution, not just changes in averages.
why distribution matters more than averages
traditional industry analysis often focuses on median or average ebitda. distribution-based analysis reveals a deeper truth:
- a rising median can occur even while many firms struggle
- a healthier distribution means fewer firms at risk and greater financial resilience overall
the 2025 data shows improvement on both dimensions.
accounttech perspective
“generally, distribution tells us whether improvement is structural or cosmetic,” said blagden. “what i see here is structural. firms are exiting deep-loss positions and clustering into sustainable operating ranges. that shows that our industry is stabilizing.”
about the research
this analysis is based on accounttech’s standardized brokerage financial benchmarking framework, which normalizes ebitda and margin data to ensure consistent comparisons across companies and years.
the summarized distribution data reflects multi-year, full-year brokerage results, segmented by ebitda margin bands to show how profitability is evolving across the market.
this research reinforces accounttech’s role as the industry’s financial system of record, capable of analyzing brokerage performance not just at the top line, but across the full operating spectrum.
white-paper appendix
appendix a: ebitda distribution methodology
this research applies a distribution-based analytical framework to brokerage ebitda results, rather than relying solely on averages or medians. companies are grouped into discrete ebitda margin bands, each representing a fixed percentage range of ebitda as a share of income. these bands are consistent across years, enabling true year-over-year comparison.
the purpose of this approach is to observe population movement across profitability ranges. instead of tracking individual firms longitudinally, the analysis examines how the overall industry distribution shifts — specifically, whether firms are clustering into sustainable ranges or accumulating in loss-making categories. this method allows structural change to be distinguished from isolated performance outliers.
only full-year financial results are included in the analysis to avoid seasonal distortion. ebitda is calculated using standardized accounttech definitions to ensure comparability across companies.
appendix b: year-over-year distribution shifts
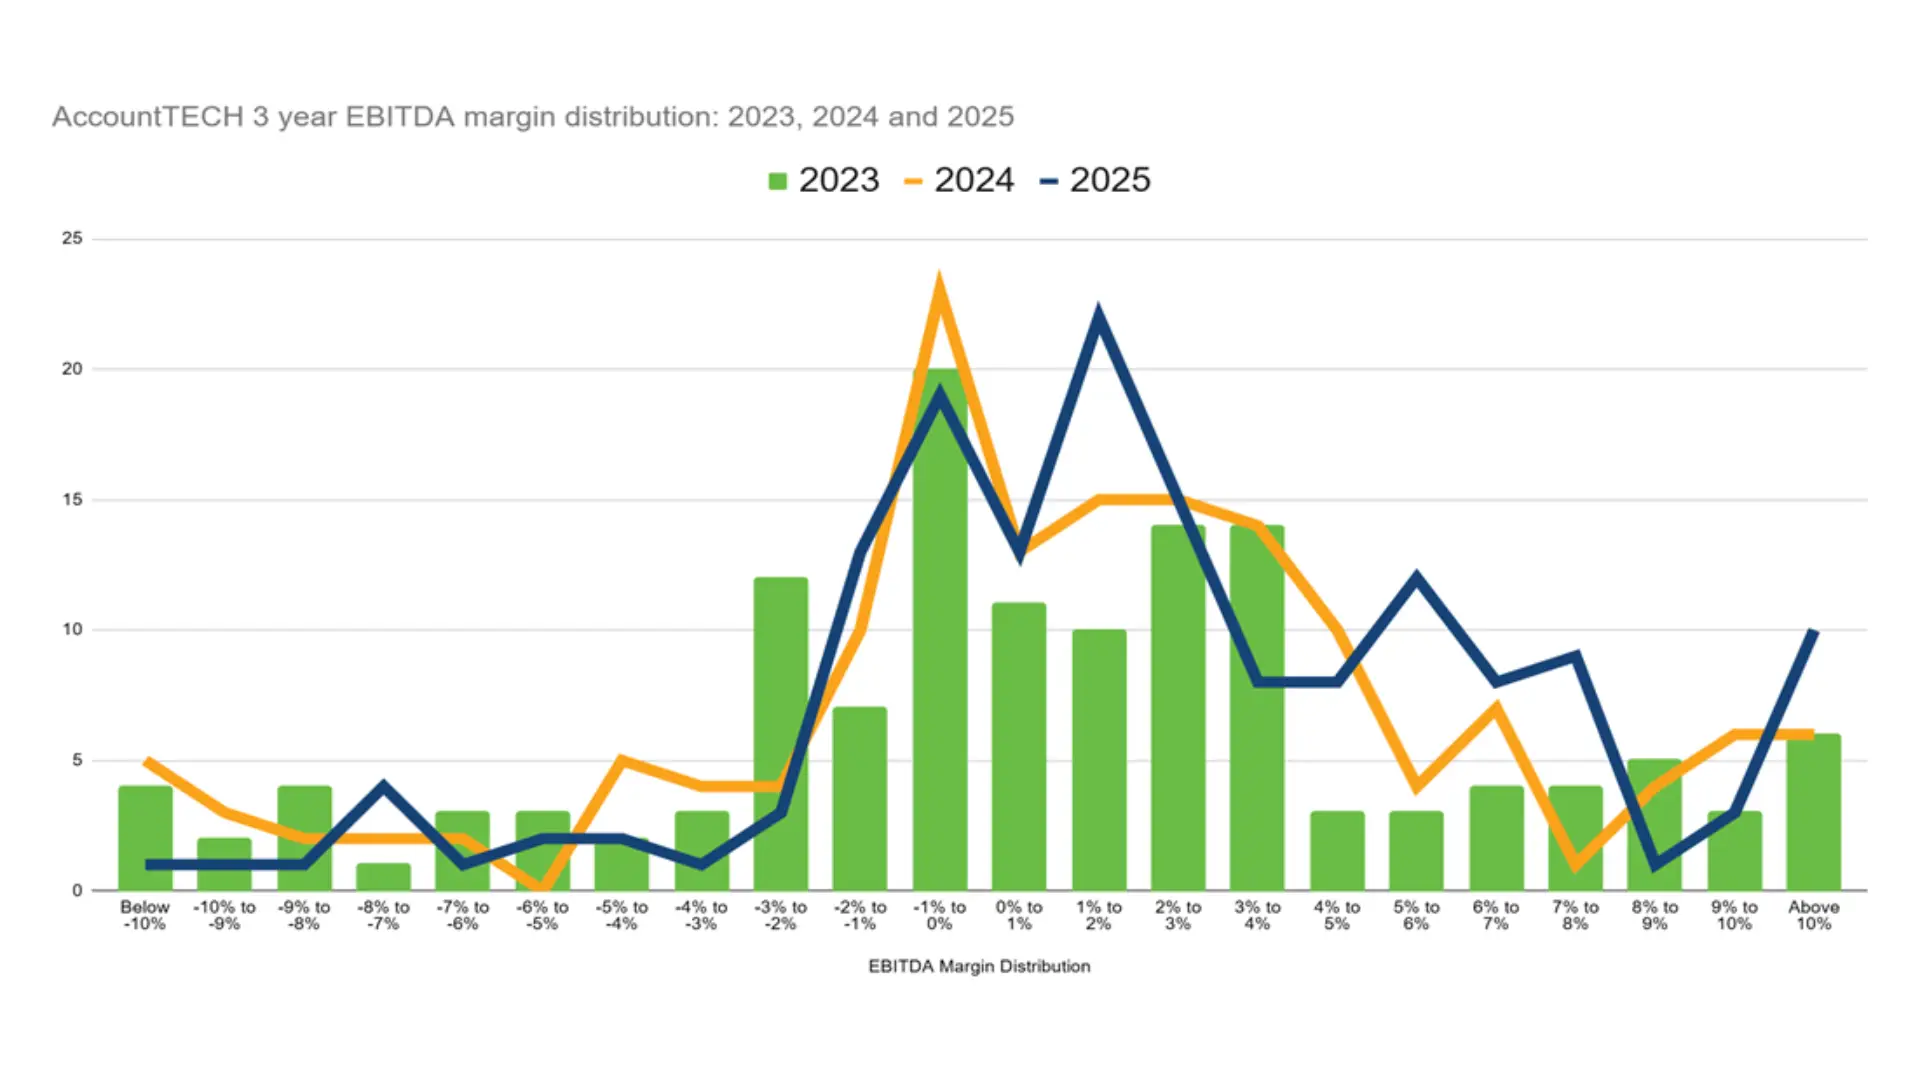
between 2023 and 2025, the distribution of brokerage ebitda shows clear and directional movement. the most pronounced change is the contraction of deep negative ebitda bands, indicating a reduction in the number of firms experiencing material operating losses.
at the same time, there is visible expansion in the breakeven and low-positive ebitda ranges. this reflects a broad-based stabilization effect, where firms are exiting loss positions and consolidating into modestly profitable operating territory. higher ebitda bands also show gradual expansion, though the primary shift is concentrated in the middle of the distribution — not exclusively at the top end.
these year-over-year movements demonstrate that improvement is occurring across the population, rather than being driven by a small subset of high-performing firms.
- decline in negative ebitda density
- vexpansion of breakeven and low-positive ranges
- gradual thickening of higher ebitda bands
appendix c: why distribution-based analysis changes the conversation
distribution-based analysis provides insight that traditional summary statistics cannot. a median or average ebitda figure may improve even if a large portion of firms remain unprofitable. by contrast, examining the full distribution reveals whether financial improvement is structural and widespread.
in this research, distribution analysis makes it possible to identify risk concentration, measure the shrinking footprint of loss-making firms, and observe the emergence of a financially stable middle tier. this approach highlights normalization and resilience trends that are invisible in single-point metrics.
for industry leaders, investors, and operators, distribution analysis reframes the discussion from isolated performance to systemic health — clarifying whether profitability gains represent durable progress or temporary variance.
ready to evolve?
request a demo or learn more about the power of darwin.Cloud