Back to Blog
Published on March 15, 2023
darwin.Cloud for agents training videos

Plan your roll-out of darwin.Cloud for agents using this library of eductional videos.
Here are some resources for Broker/Owners to use when training agents on darwin Cloud
Videos about 2 factor login security:
https://accounttech.com/2factorlogin/
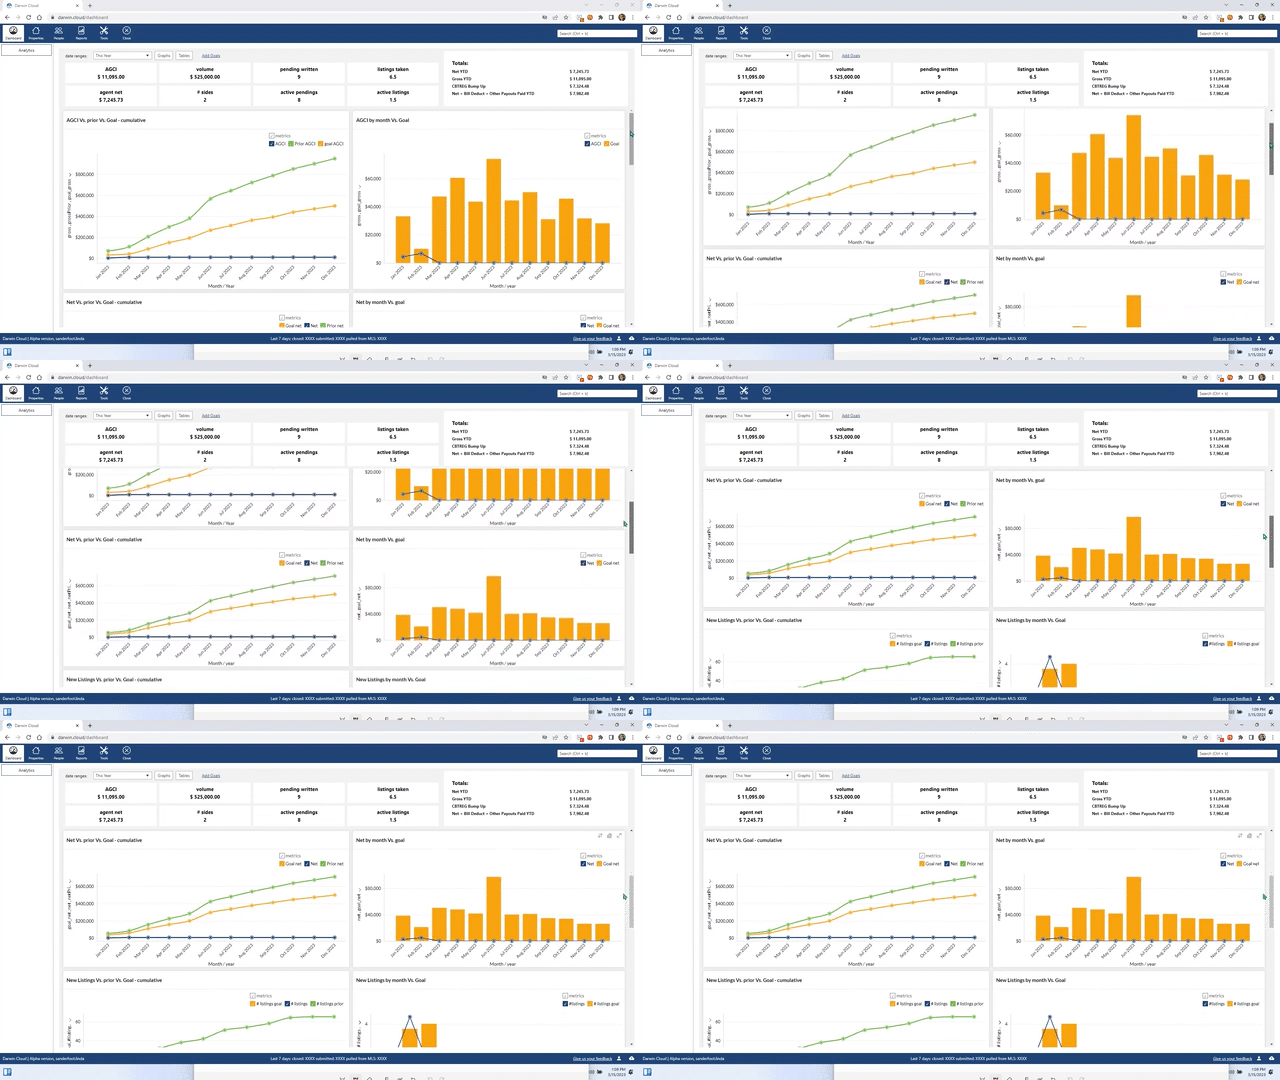
Video introduction to darwin analytics
https://accounttech.com/darwincloudforAgentsAnalytics/
Navigating analytics dashboards in darwin Cloud
https://accounttech.com/darwincloudInteractive/
Adding your personal goals for this year into darwin Cloud
https://accounttech.com/darwincloudSetGoals/
ready to evolve?
request a demo or learn more about the power of darwin.Cloud