product
accounting
reporting
integrations
cloud
security
plans
resources
blog
benchmark studies
demo videos
analytic dashboards
consultants
help center
schedule a meeting
darwin API
about
careers
get started
login
get started
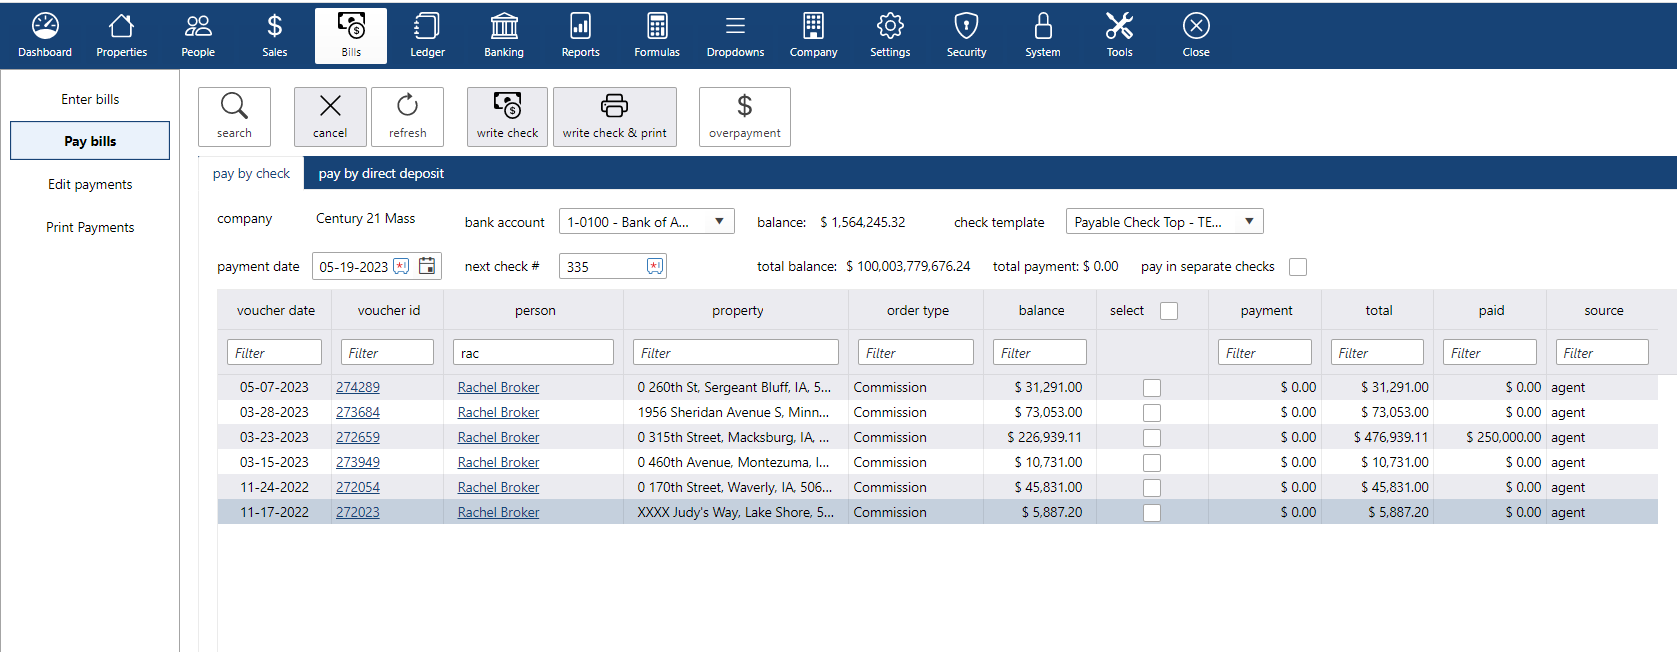
Commissions left in company