report samples
reporting that delivers clear summaries and interactive drill-down into the details.
now, more than ever, you need reliable numbers to guide important decisions.
the reports in darwin let you modify the data that appears in each report. you can add or remove data fields to get exactly the information you need—no more, no less.
performance reports that connect agent production with profitability
understand the link between agent productivity and your brokerage’s bottom line.
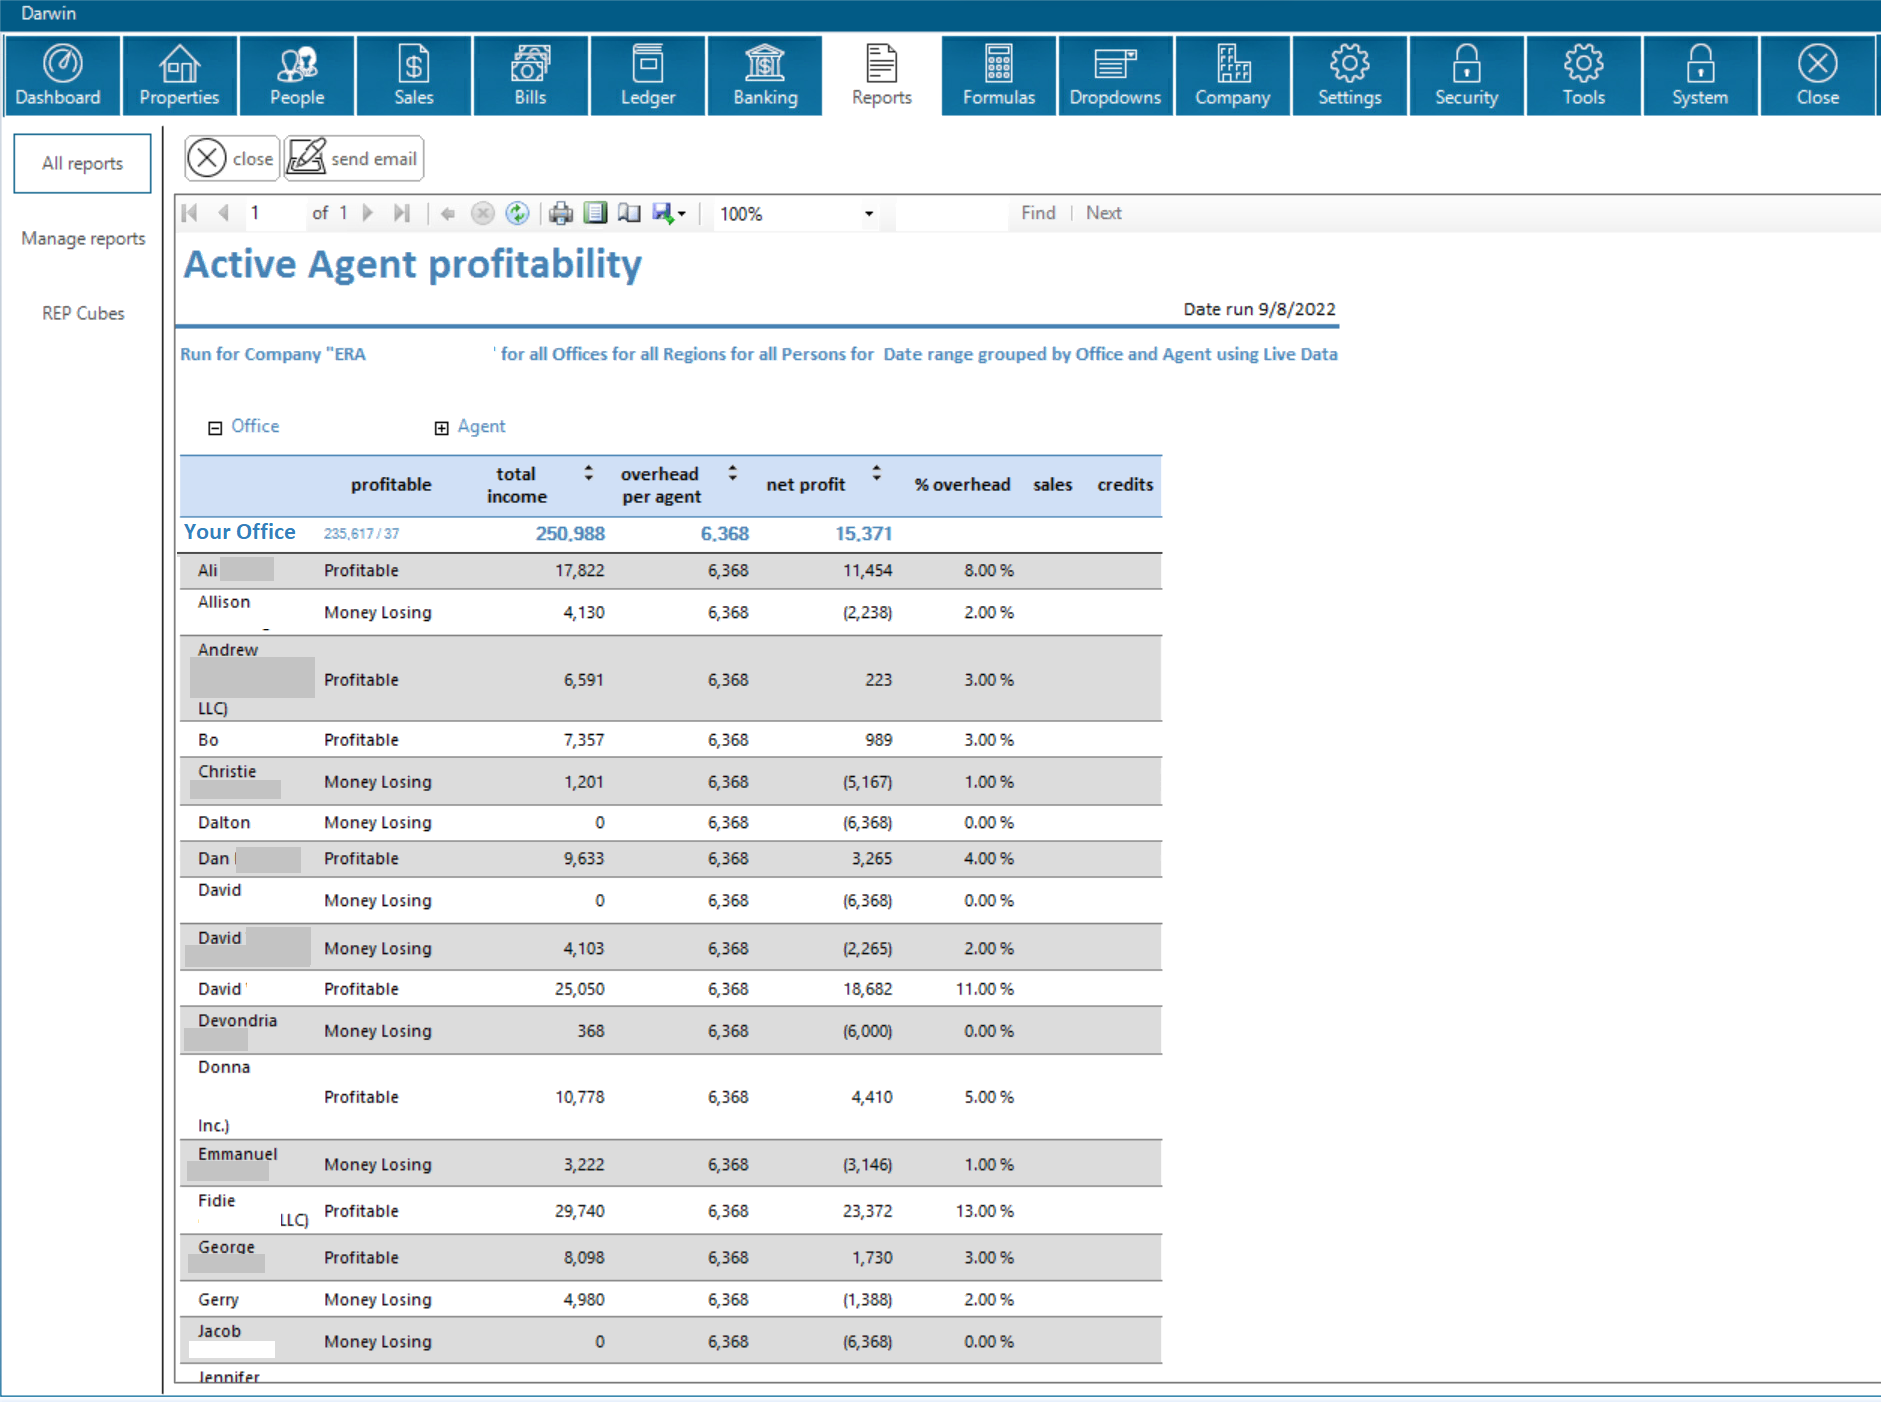
profitability per agent
every brokerage has fixed monthly costs—rent, salaries, software, marketing, and more. those costs are covered entirely by the broker/owner’s share of closed commissions. because darwin tracks both revenue and expenses, it can show whether each agent is contributing enough to cover their share of the overhead. this helps identify which agents are profitable—and which are not. sampledependency risk - if just a few agents are responsible for most of your brokerage’s income, your business may be at risk. what happens if one or two top producers leave? in the example shown, 42% of the monthly overhead is being paid by only 4 out of 37 agents. identifying this early allows you to plan ahead and protect your business from sudden income loss. sample
CMOE - Current Month Overhead Expense analysis. every office develops a baseline for what it costs to “keep the doors open.” using CMOE, you can compare that baseline to the pipeline of pending transactions. how far into the future are your operating expenses covered? this report helps you predict revenue coverage and manage cash flow more effectively. sample
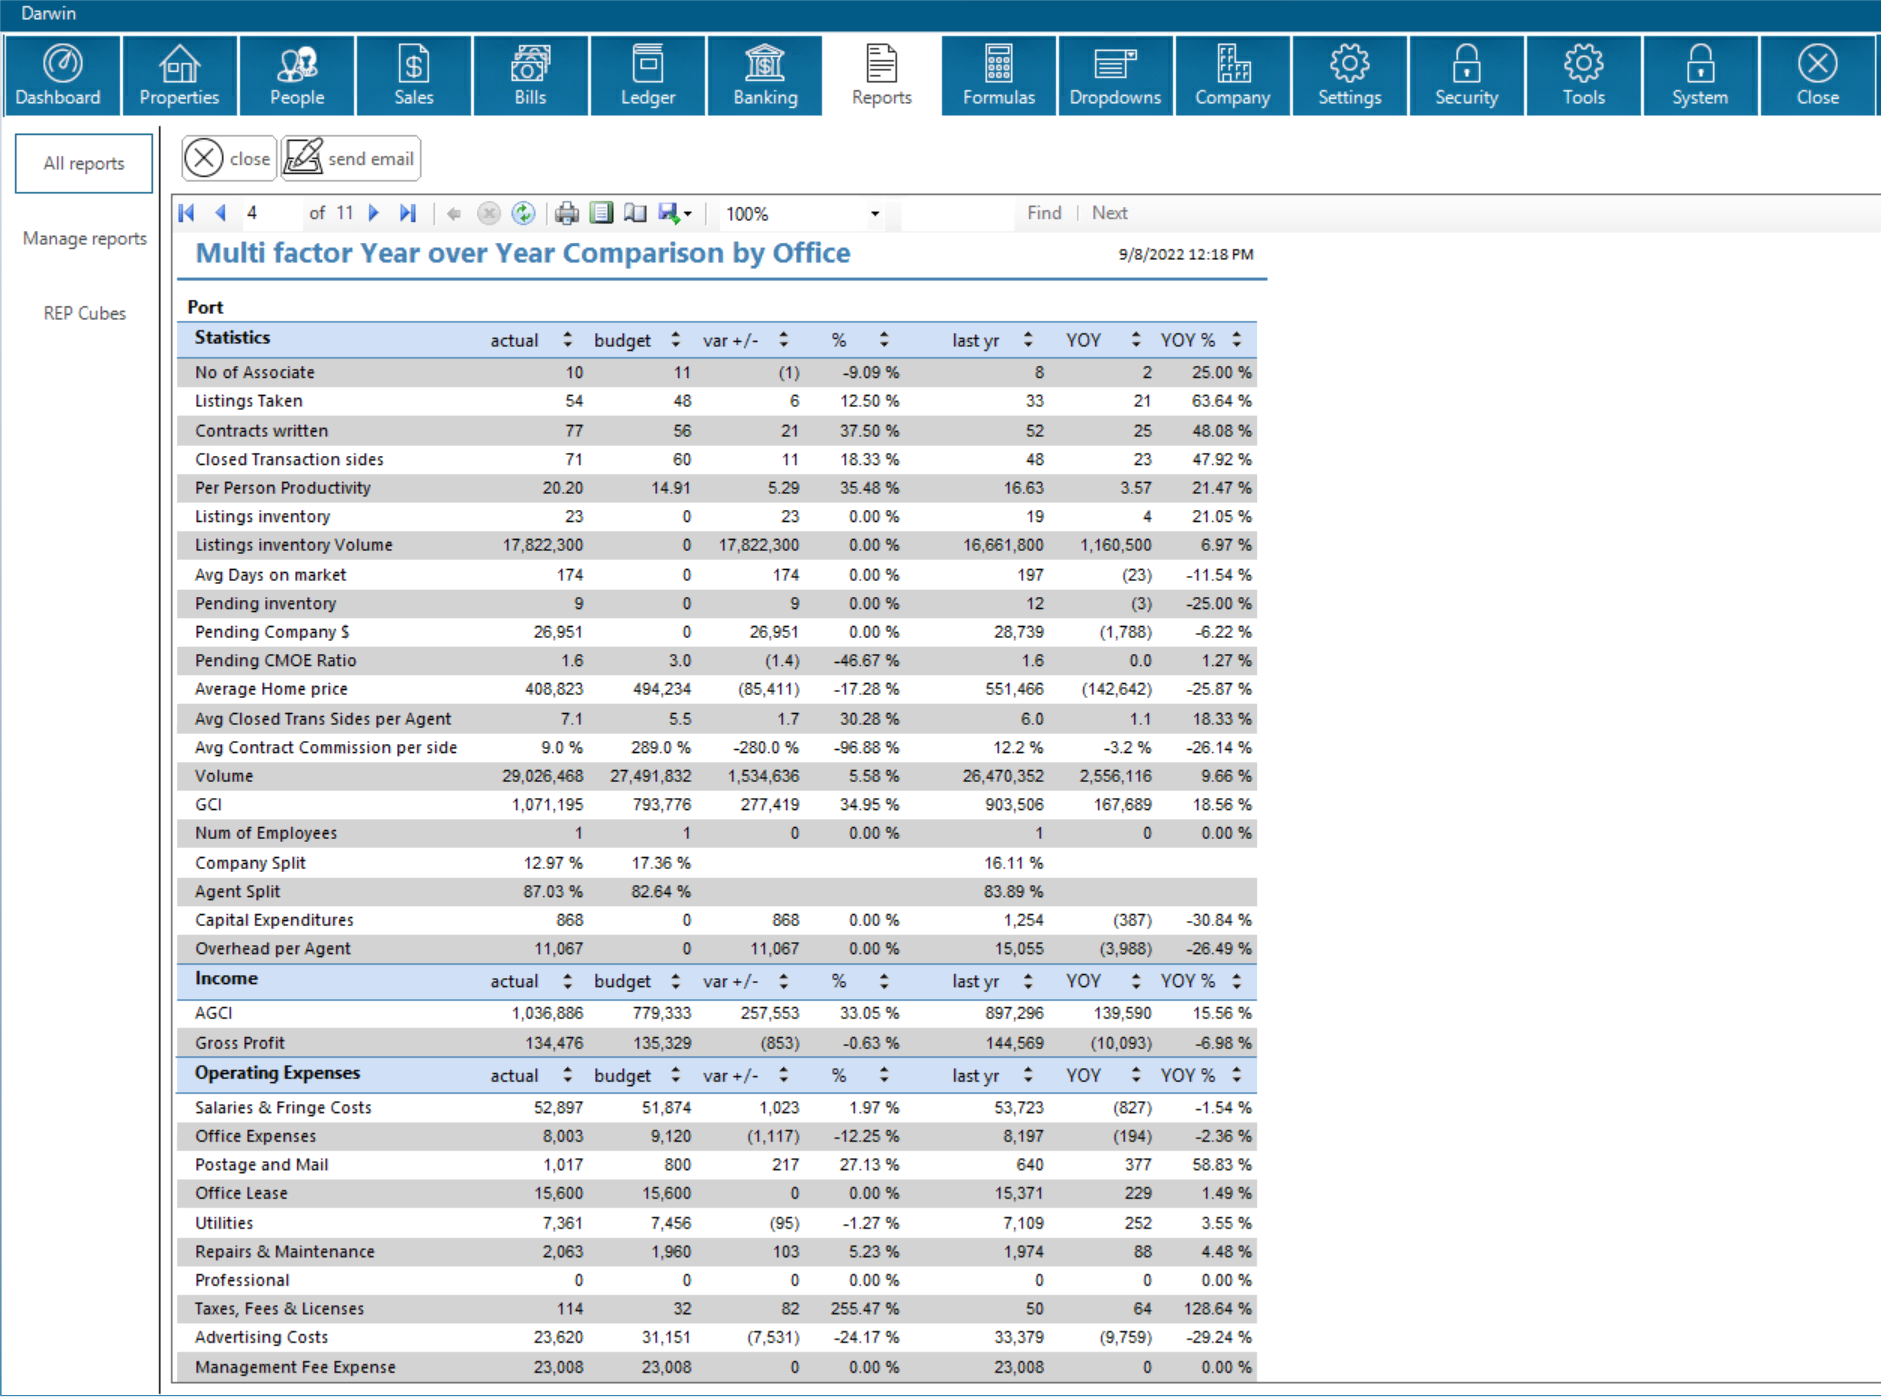
multi factor performance to budget - profit and loss reports are just one piece of the puzzle. darwin allows you to compare your actual performance to budget across multiple dimensions—commission revenue, expenses, agent productivity, and more. get a comprehensive view of how your brokerage is tracking against goals, all in a single dashboard. sample

profit and loss reports
- simple profit and loss - show this month vs same month last year. And it YTD with YTD last year
- profit and loss can be expanded to show each account that makes up the totals
- each individual amount can be expanded to see all the debits and credits that make up the balances
- each line item provides a link to the details of each individual posting
- download a sample chart of accounts
- download a sample Profit and Loss
- profit and loss by month (scroll down for more detail)
- profit and loss by office
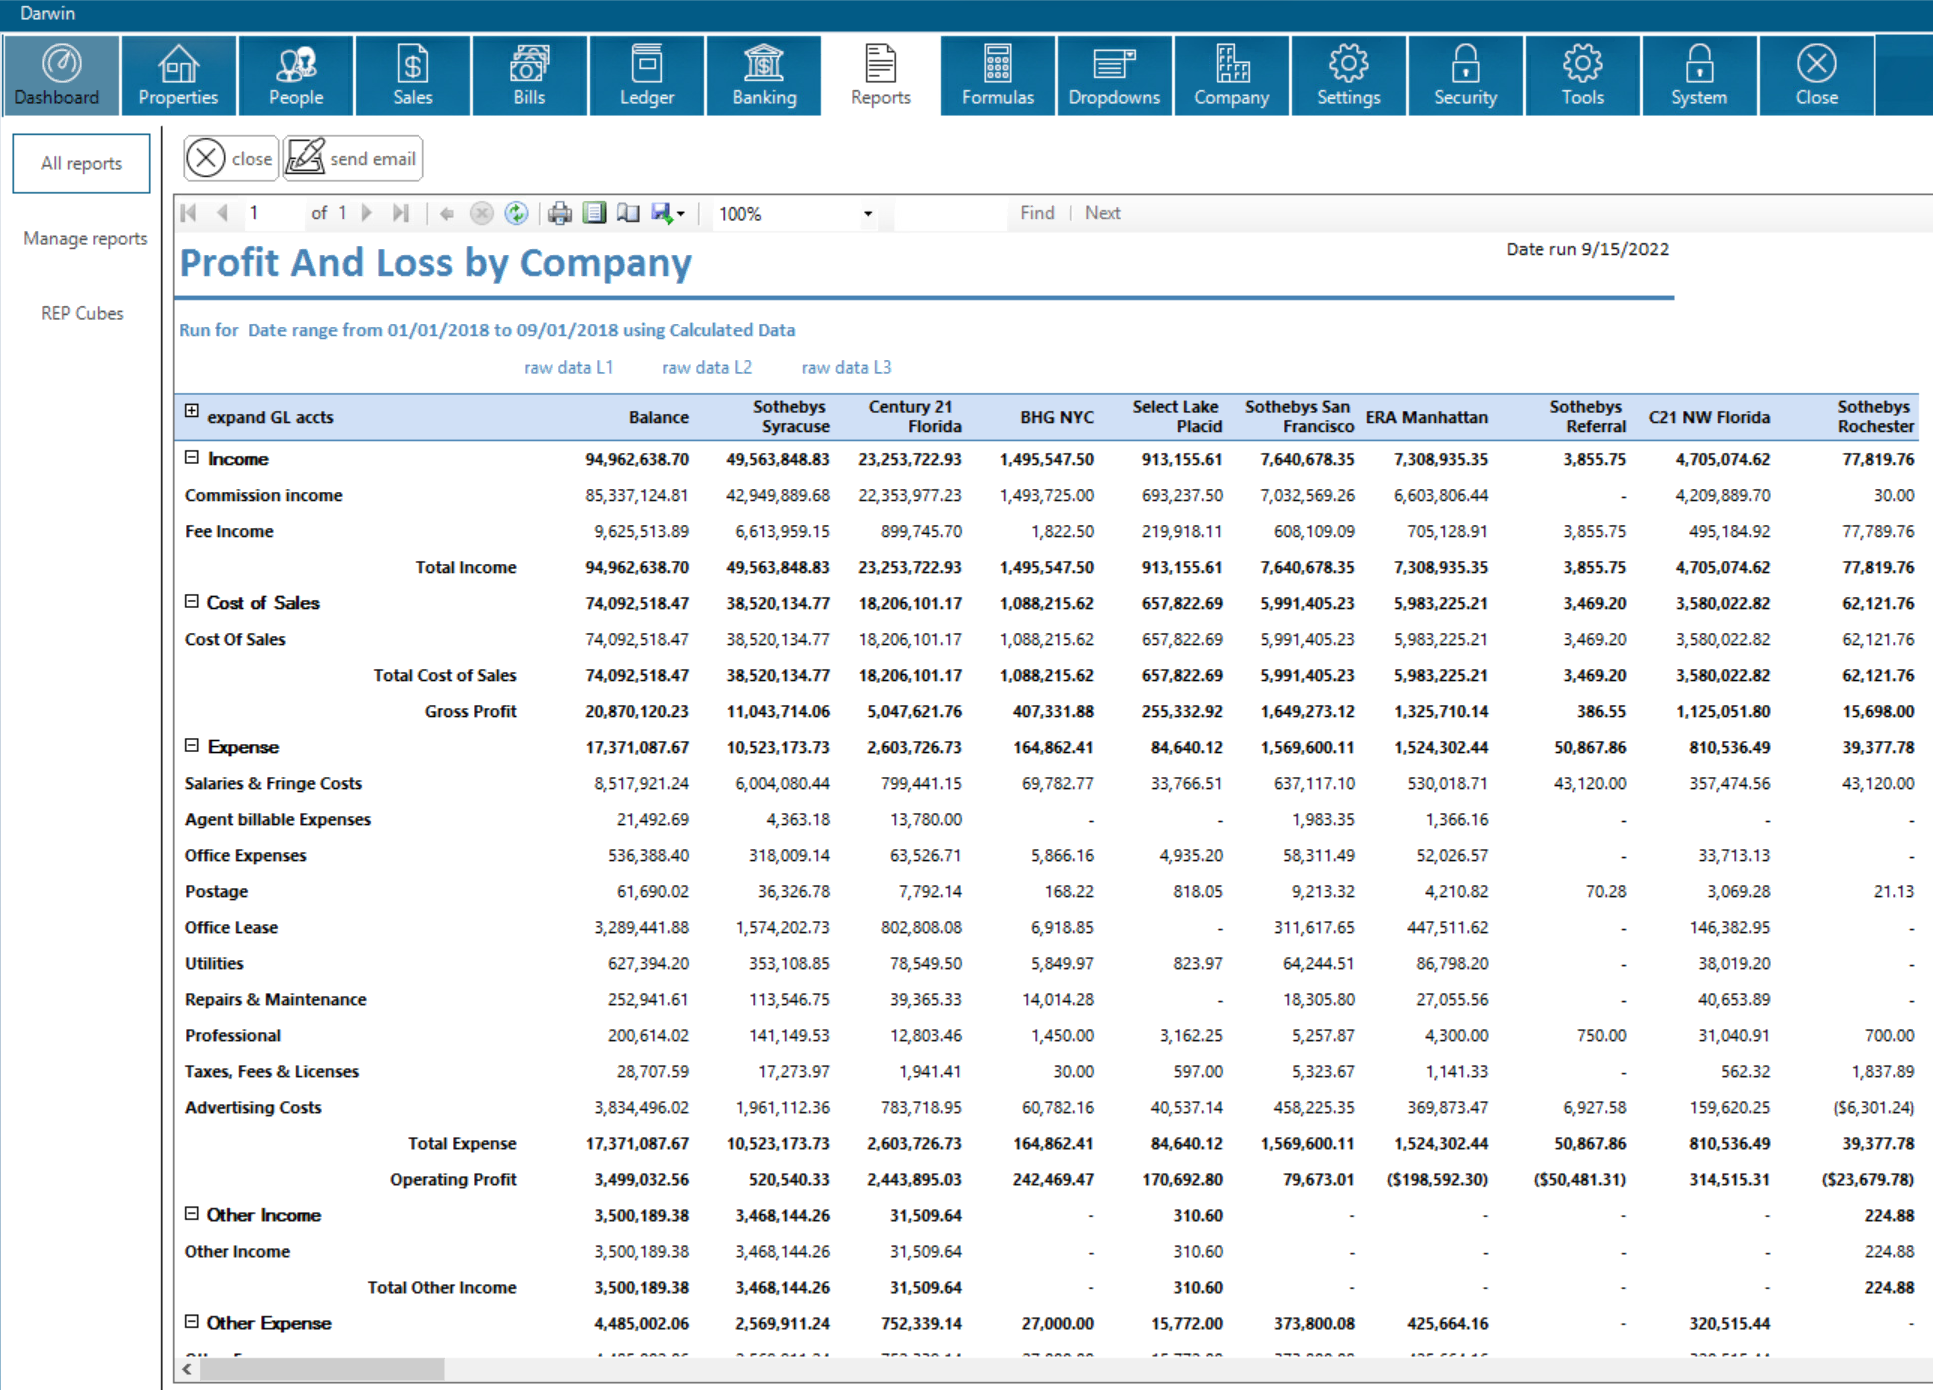
- profit and loss by company. if you own more than one company or partnership, you will keep them all in darwin and run them simultaneously in a single software. this allows you to run a Profit and Loss with all your companies side-by-side
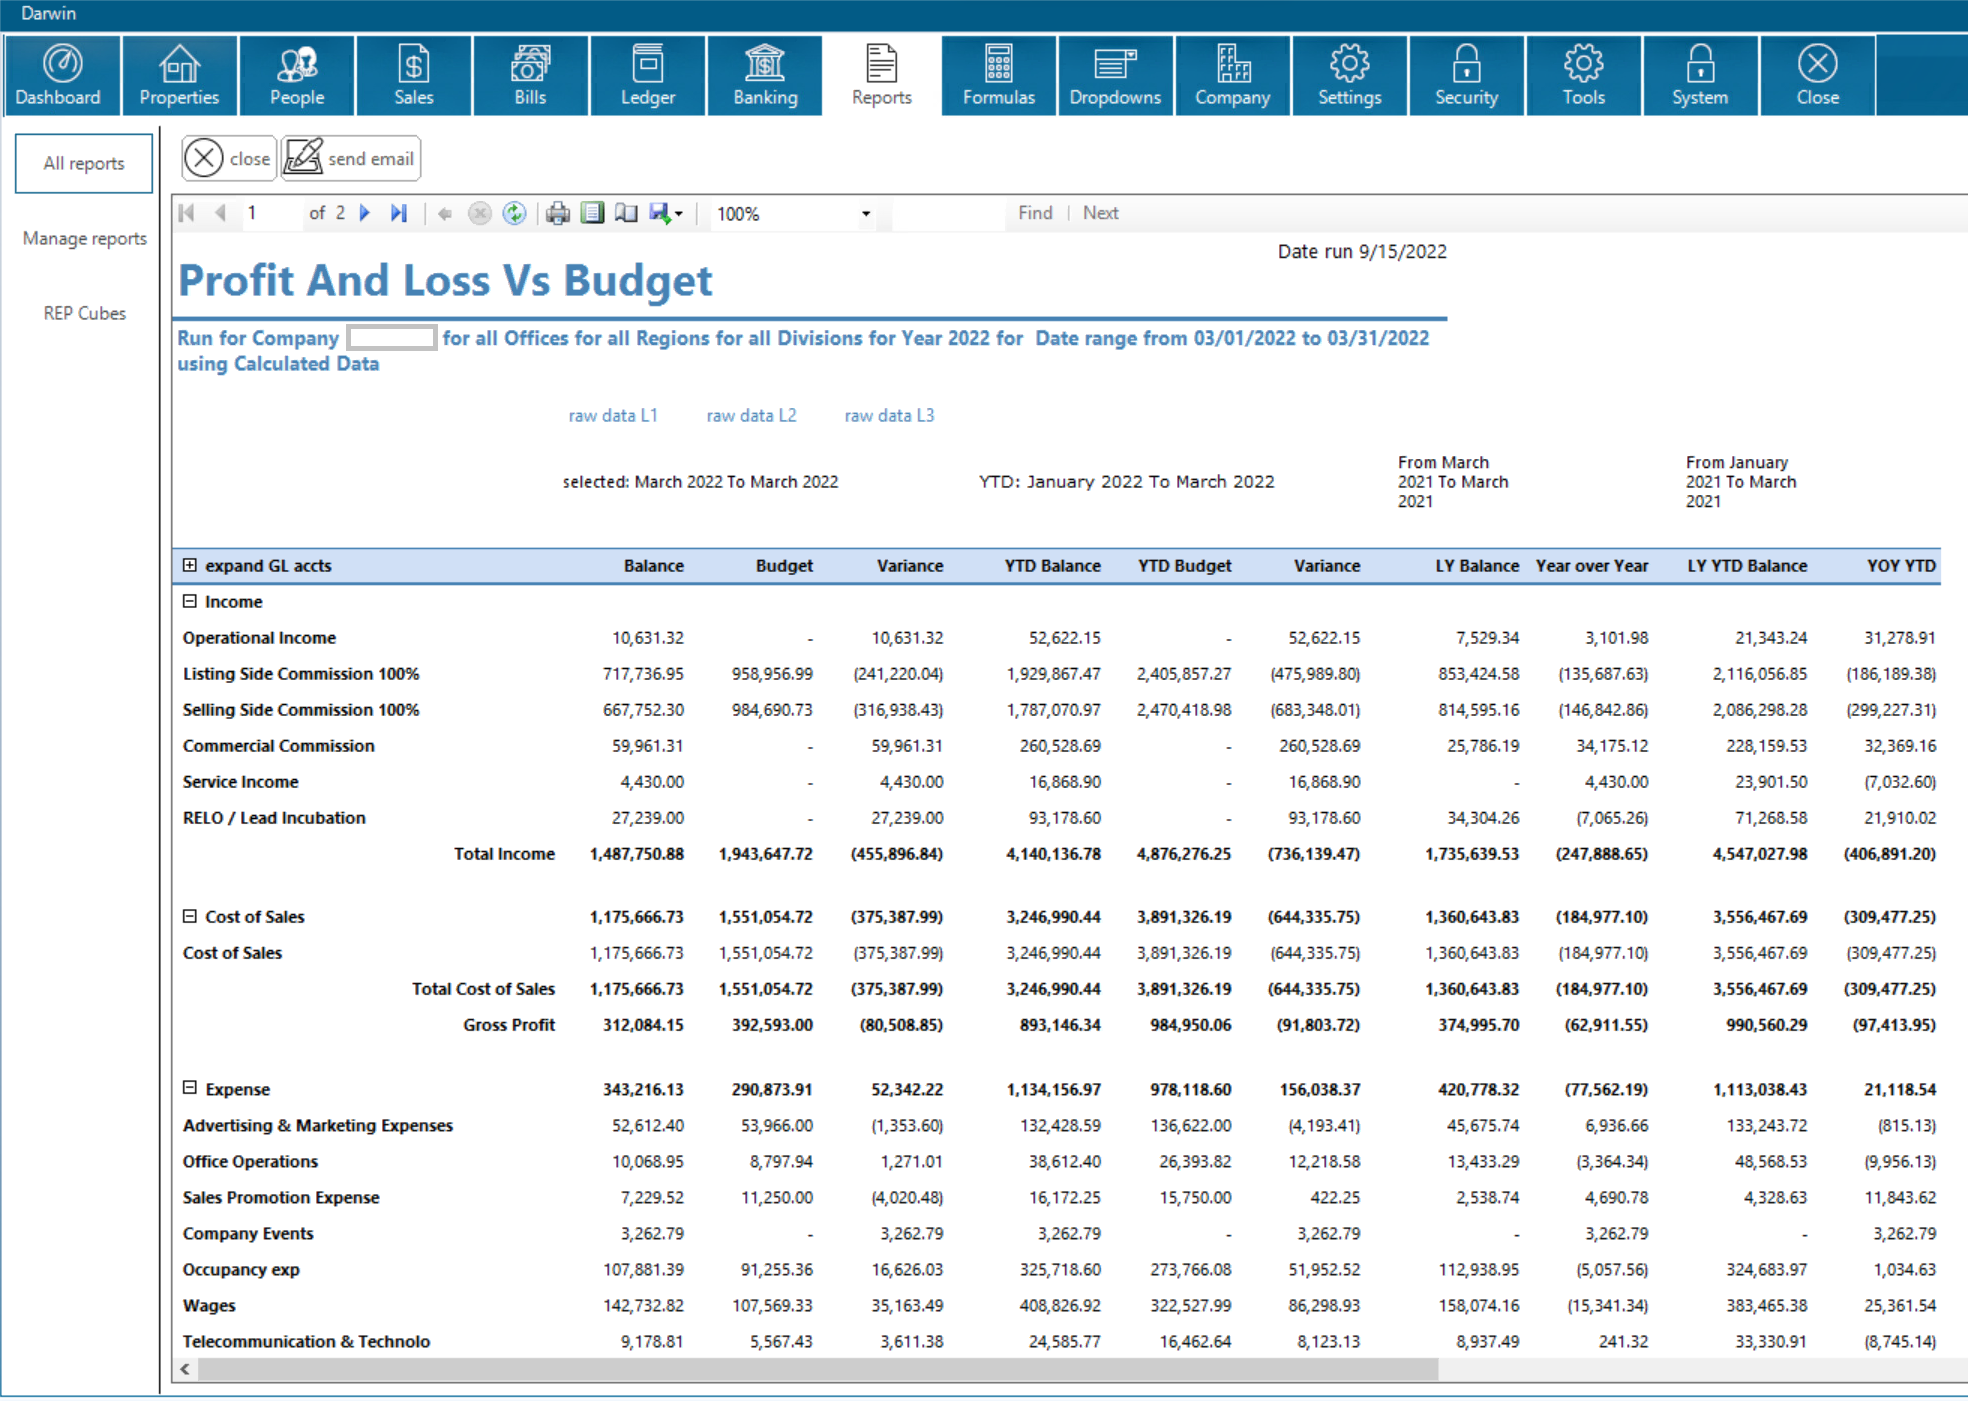
- profit and loss to budget
- key performance indicators - sometimes you want to see your profit and loss in context. so that means viewing your profit and loss while also seeing other key metrics in each office. watch this short video about multi factor analysis
- balance sheet you can see the balance sheet for each of your companies or you can see all of your company balance sheets side by side
analyze what drives your brokerage’s growth
analysis reports will guide decision-making. Some analysis reports are designed to consolidate a wealth of critical information into a comprehensive snapshot. Other analysis reports create graphics to make it easier to reveal trendlines
- office production analysis is meant to show you (by office) how much new business you write. how much business did you lose? How much business did you close, and what is currently listed for sale & what is currently pending to close?
- multi year KPI is critical when you want to see trendlines on ALL production metrics over a number of years

approved supplier program
we’re proud to announce that accounttech has been selected to join the RE/MAX Approved Supplier Program—a recognition of our proven performance, reliability, and real estate expertise.
to support re/max offices making the switch from outdated legacy software, we’ve created a suite of smart, customizable reports that simplify onboarding, streamline accounting, and ensure data continuity.
production reports
- RE/MAX statistic summary report this report shows agent's productivity in a given month and YTD with totals for residential, commercial and teams transactions. sample
- listing rank by agent and volume limited alternative to AccountTECH's in-depth ranking report, the layout of this report should appear familiar to users switching to AccountTECH from older, legacy software.
- fee deduct ALL In AccountTECH, the different deductions from AGCI are called commission deductions. in your legacy software they were likely called fees. This report shows the total of all "fees" deducted from agent's gross commission. sample
- fee deduct - Childrens Miracle Network sometimes you want to run a report that looks at a single "fee." sample
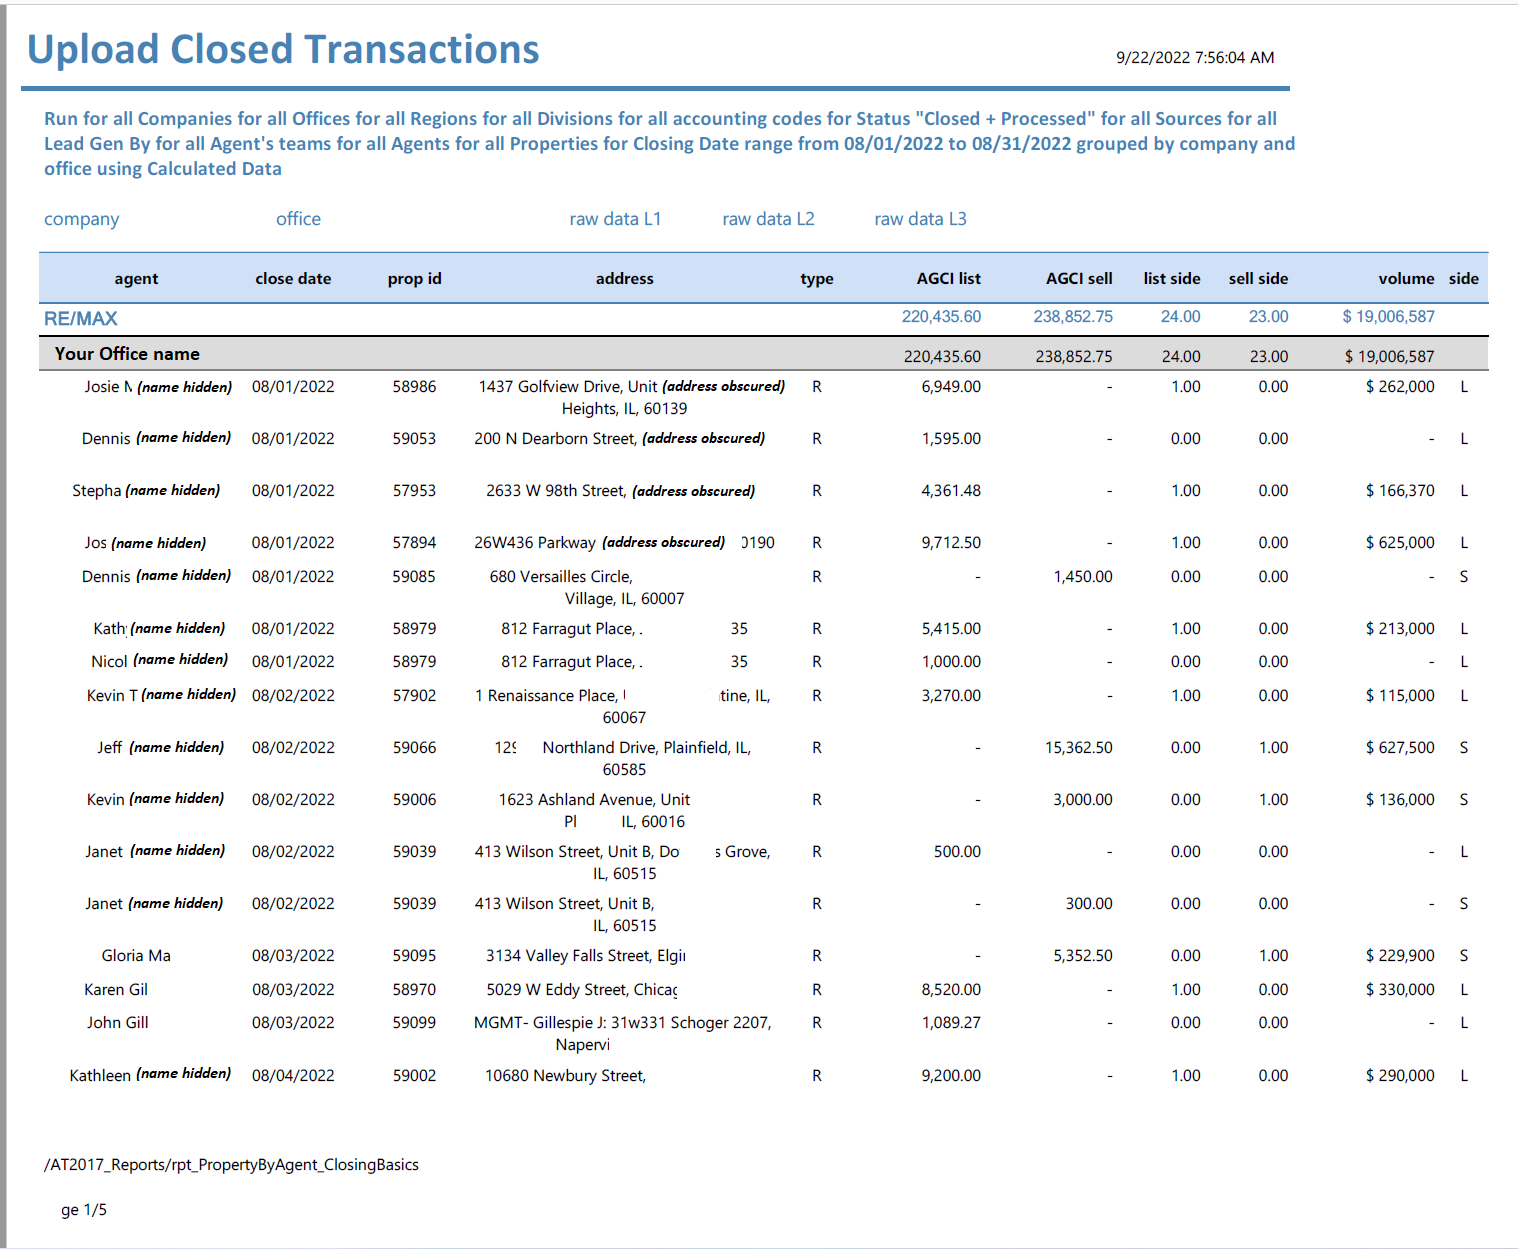
- closed transaction summary your old software likely had a report that listed all the closings for a date range with a breakdown of the production between the list and sell sides. Here is a sample of AccountTECH's version of that report. sample
- closed transaction summary by agent AccountTECH has another version of this report that is more meaningful because it groups and subtotals the production by agent.
- drill down lets you see all the transactions for each agent and like all AccountTECH reports, it includes drill down to get deeper into the numbers.
- year over year production in your old RE/MAX software, you probably looked at some production number over a number of years to see the trendline. with AccountTECH, our version of that report is so much more helpful because it shows ALL the production numbers for multiple years on a single report. sample
franchise reports
- upload transaction summary this report lists all transactions reported to RE/MAX in a date range. sample
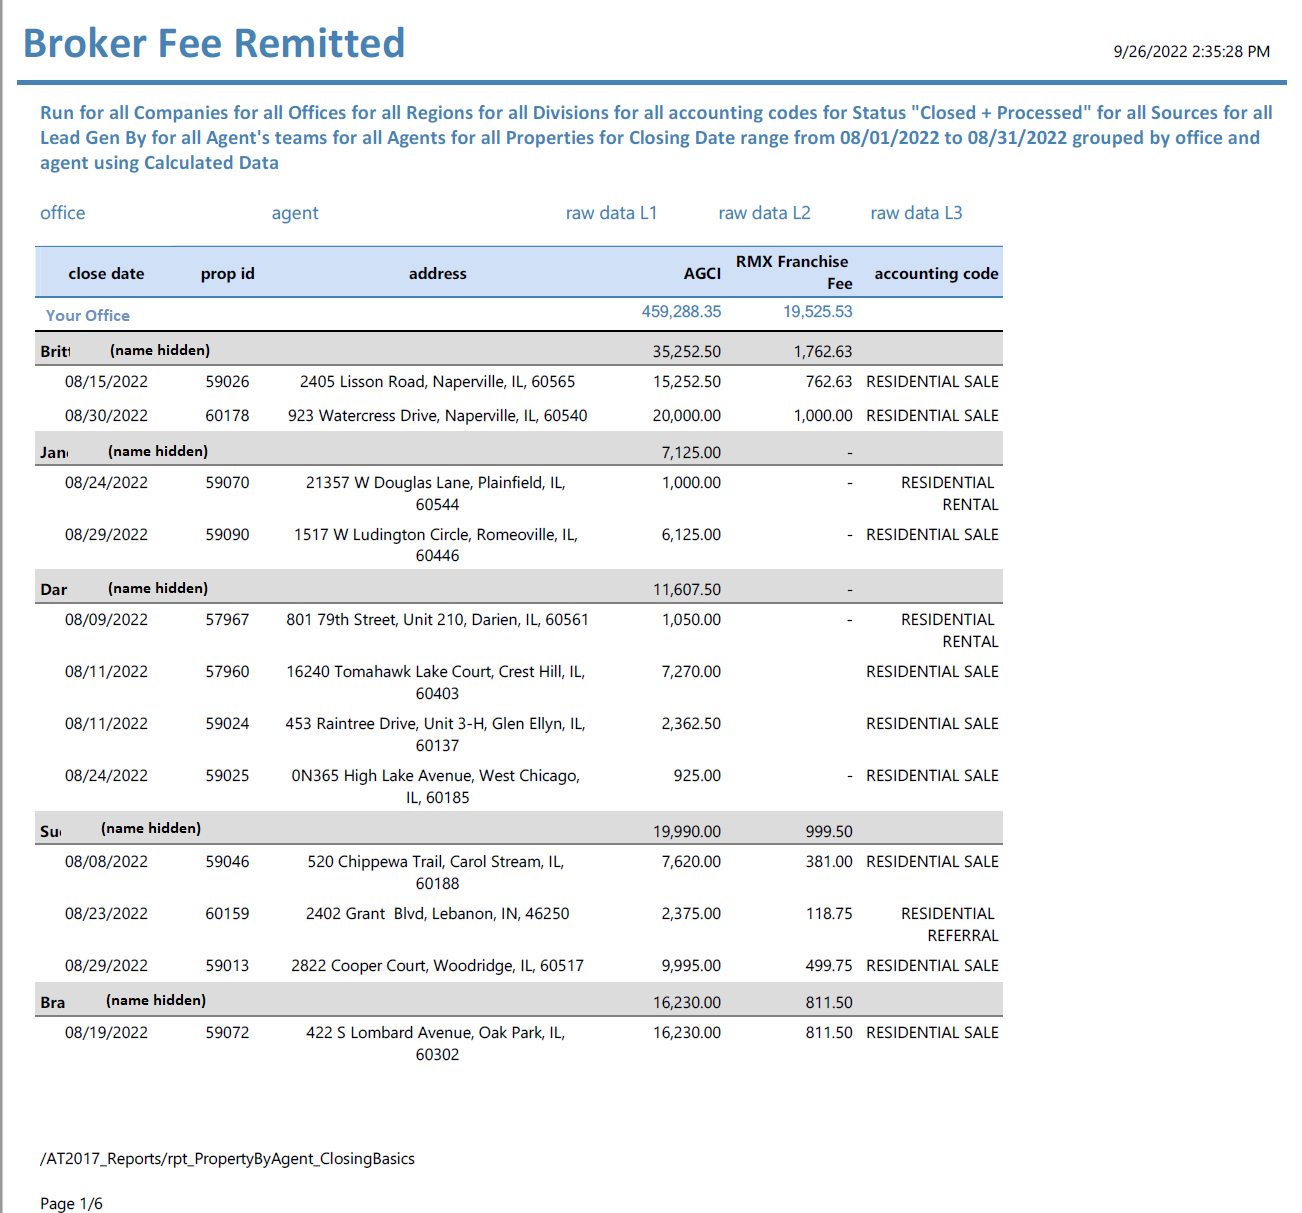
- broker remittance this report shows a summary of the royalty fee due on "non-grandfathered" agents.
- drill down on the broker remittance report lets you see each transaction that is part of the remittal.
- closing awards agents who share the commission on a closed transaction may not share the credit for the RE/MAX awards. with darwin, you can divide the commission between many agents, but have all the credit for sale, volume & sides reported to RE/MAX separately from how the money was divided. sample
- closing awards also has drill-down to see the property addresses that make up the awards totals/
finance reports
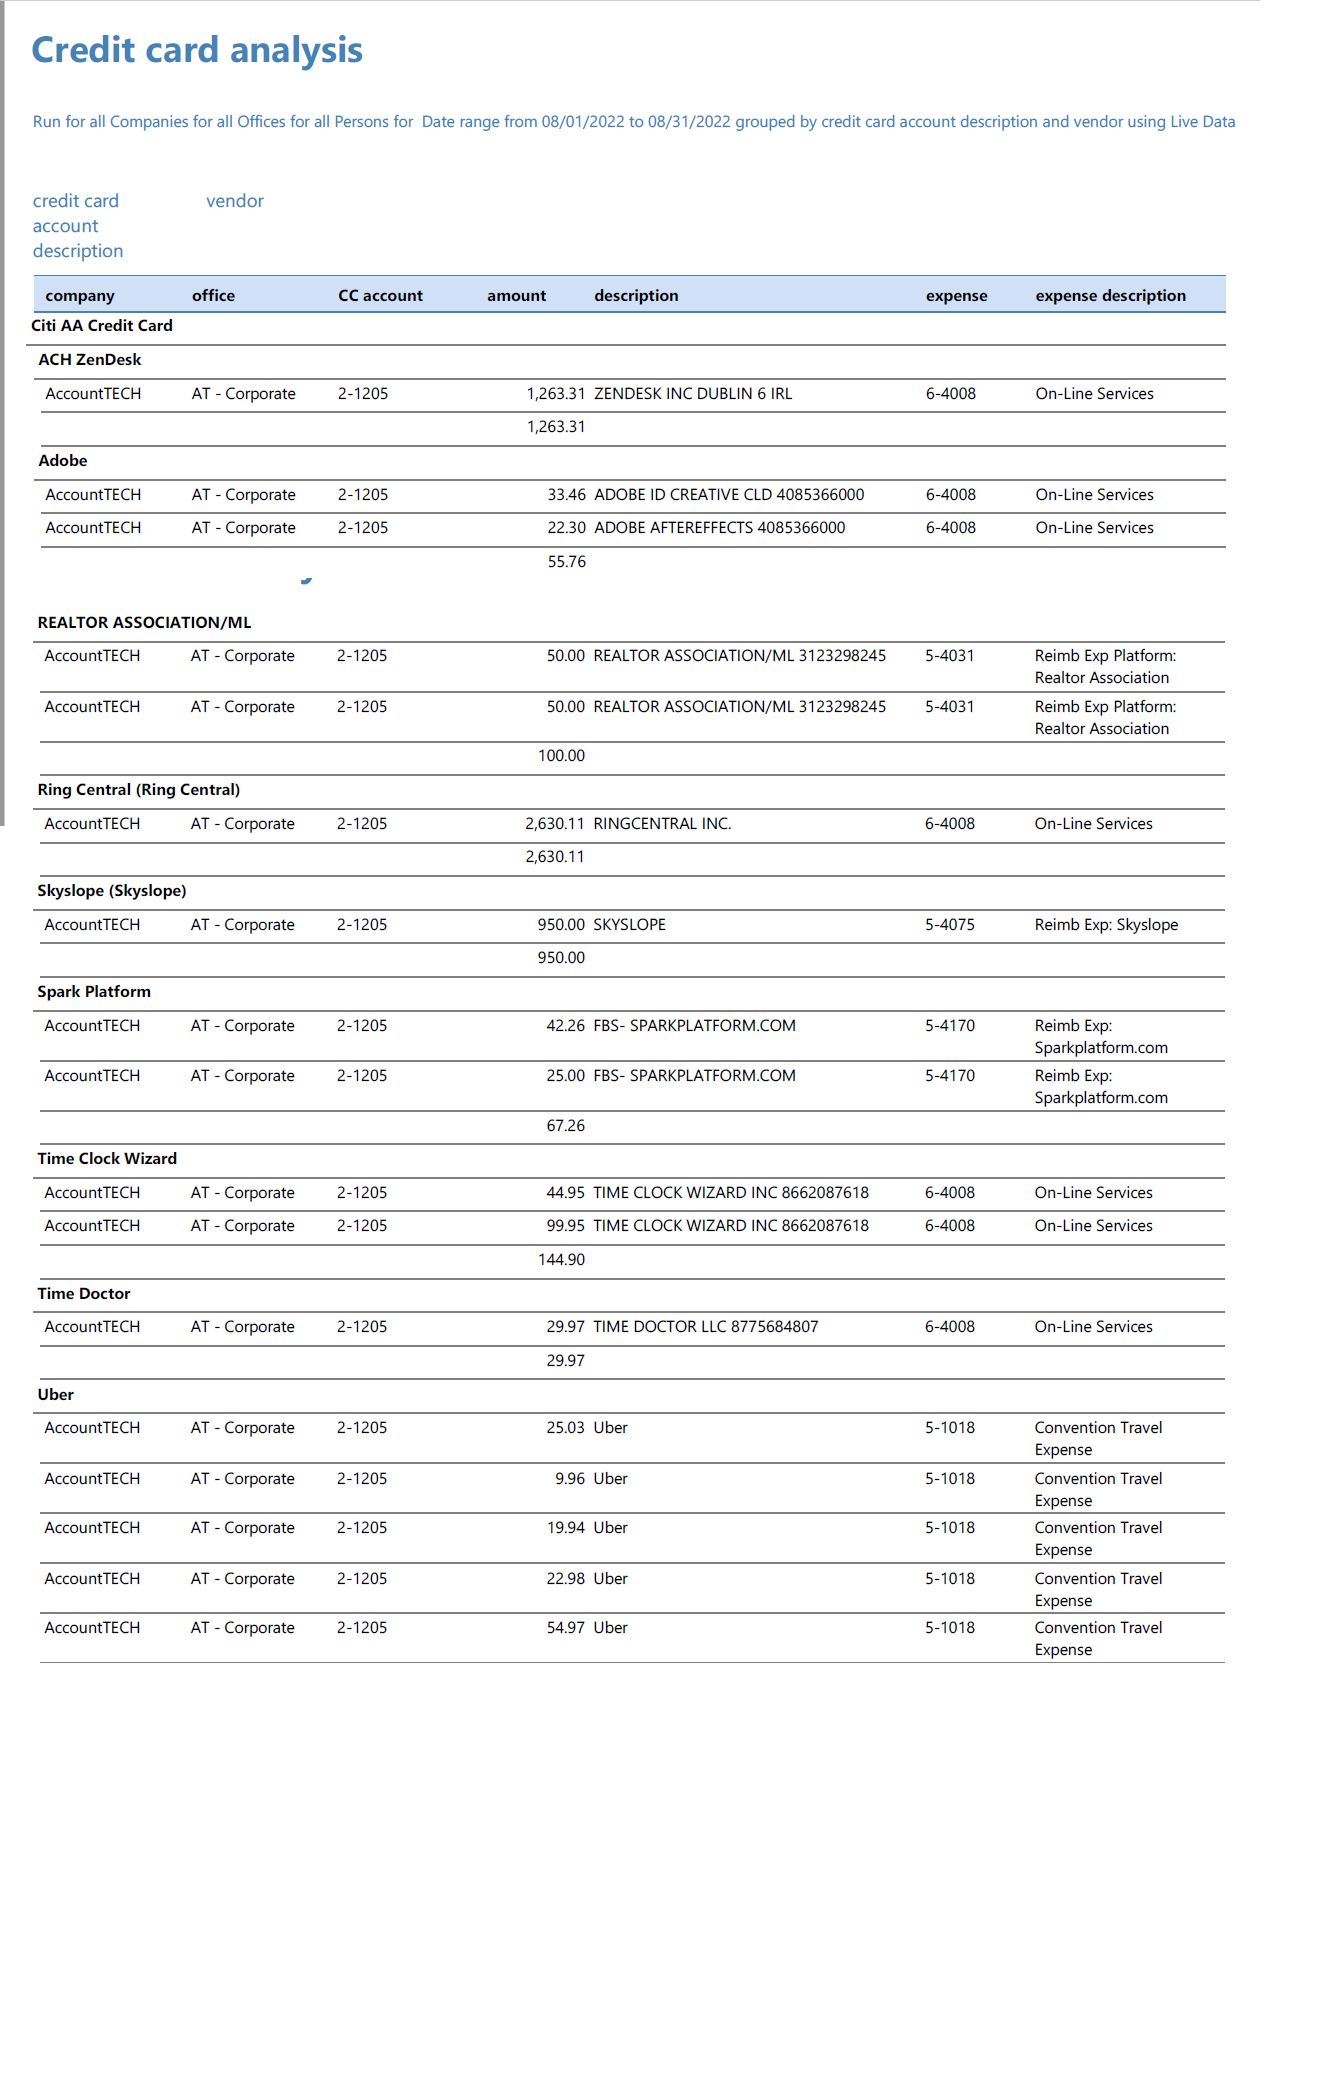
- credit card analysis When you want to review credit card charges, this report lets you see all the charges to a selected credit card and it shows the LINK of the credit card charge back to the vendor that was paid by credit card. sample
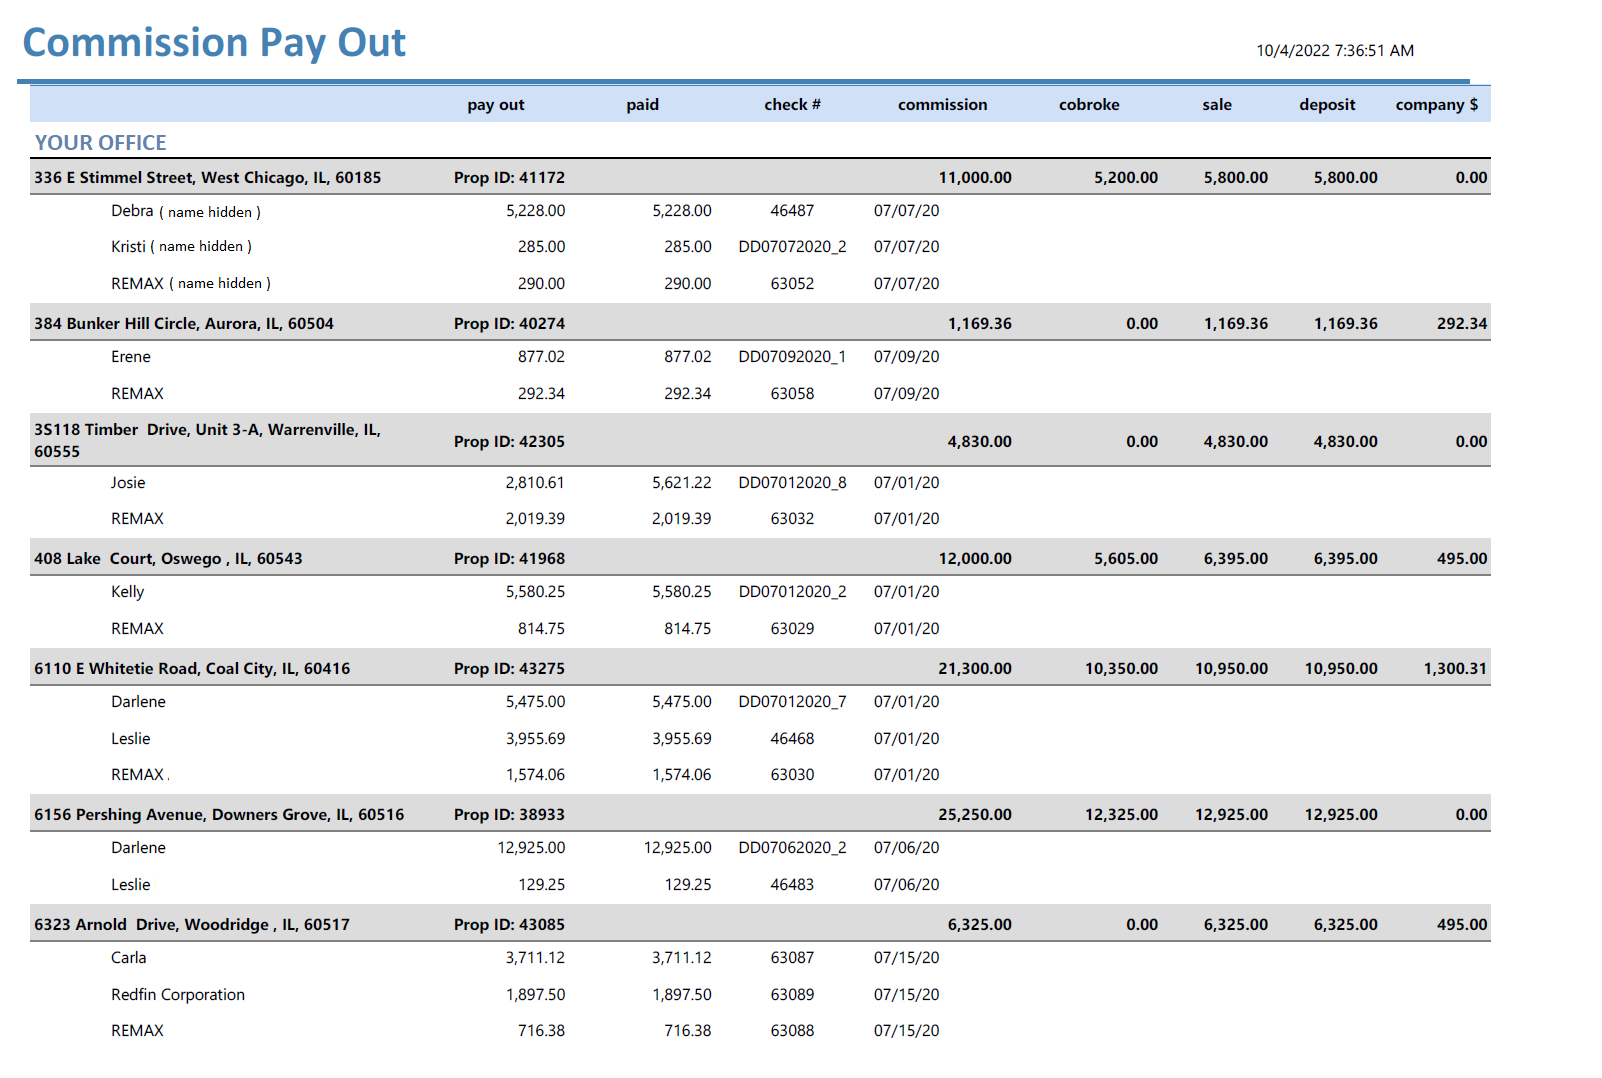
- commission pay out For a summary of the day's closings, payouts and deposits, run the commission pay out report to see all the checks and deposits that need to be paid on each closing and whether or not they have already been paid. sample
agent reports
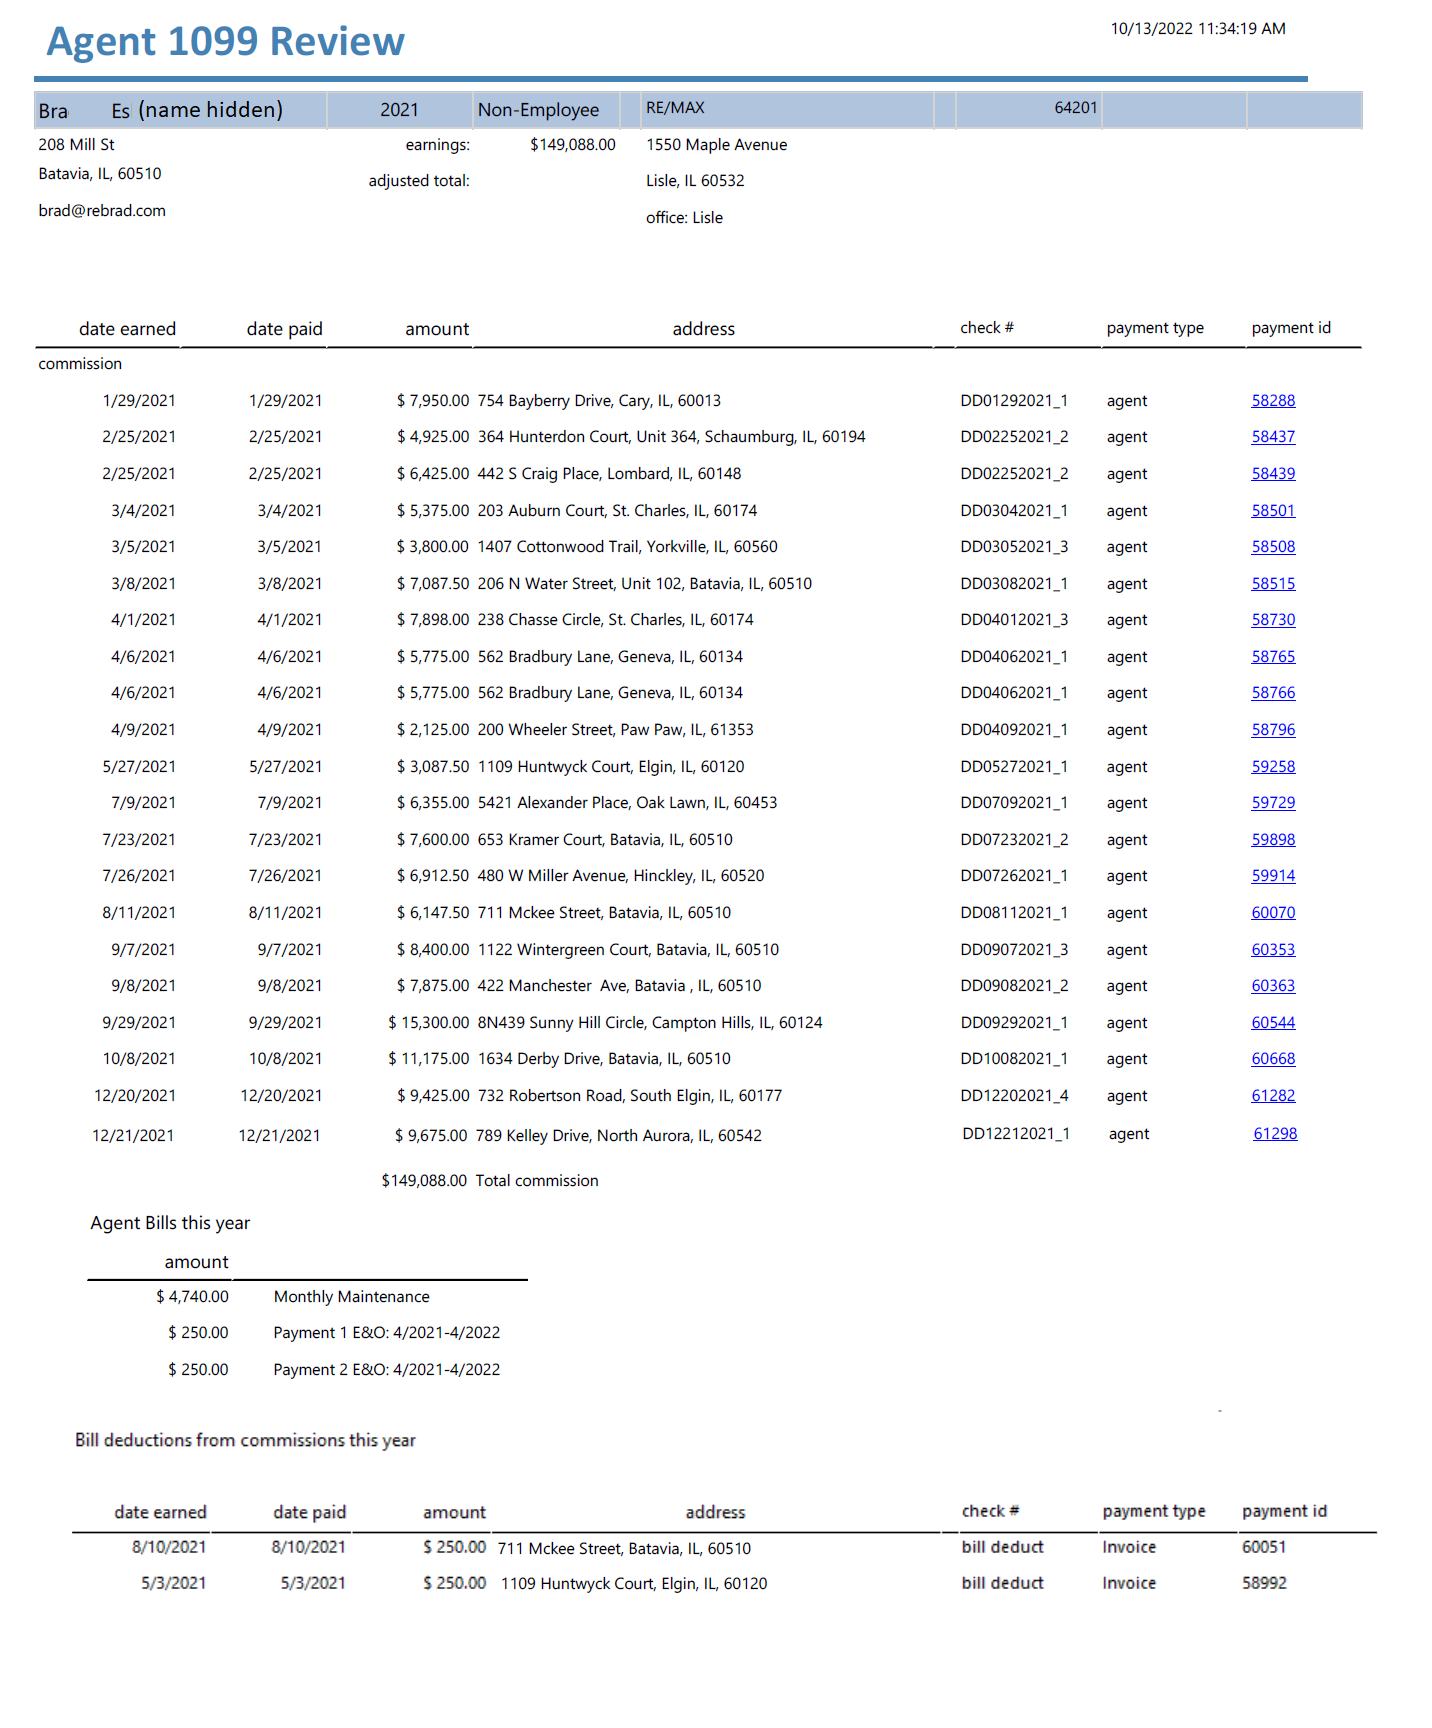
- year end 1099 summary in darwin, when you give the agent their 1099 report detail, it also includes the totals they paid for the year summarized by each item description as well as a detail of which closings through the year had an agent billing deduction for unpaid agent monthly bills. sample
buyer & seller reports
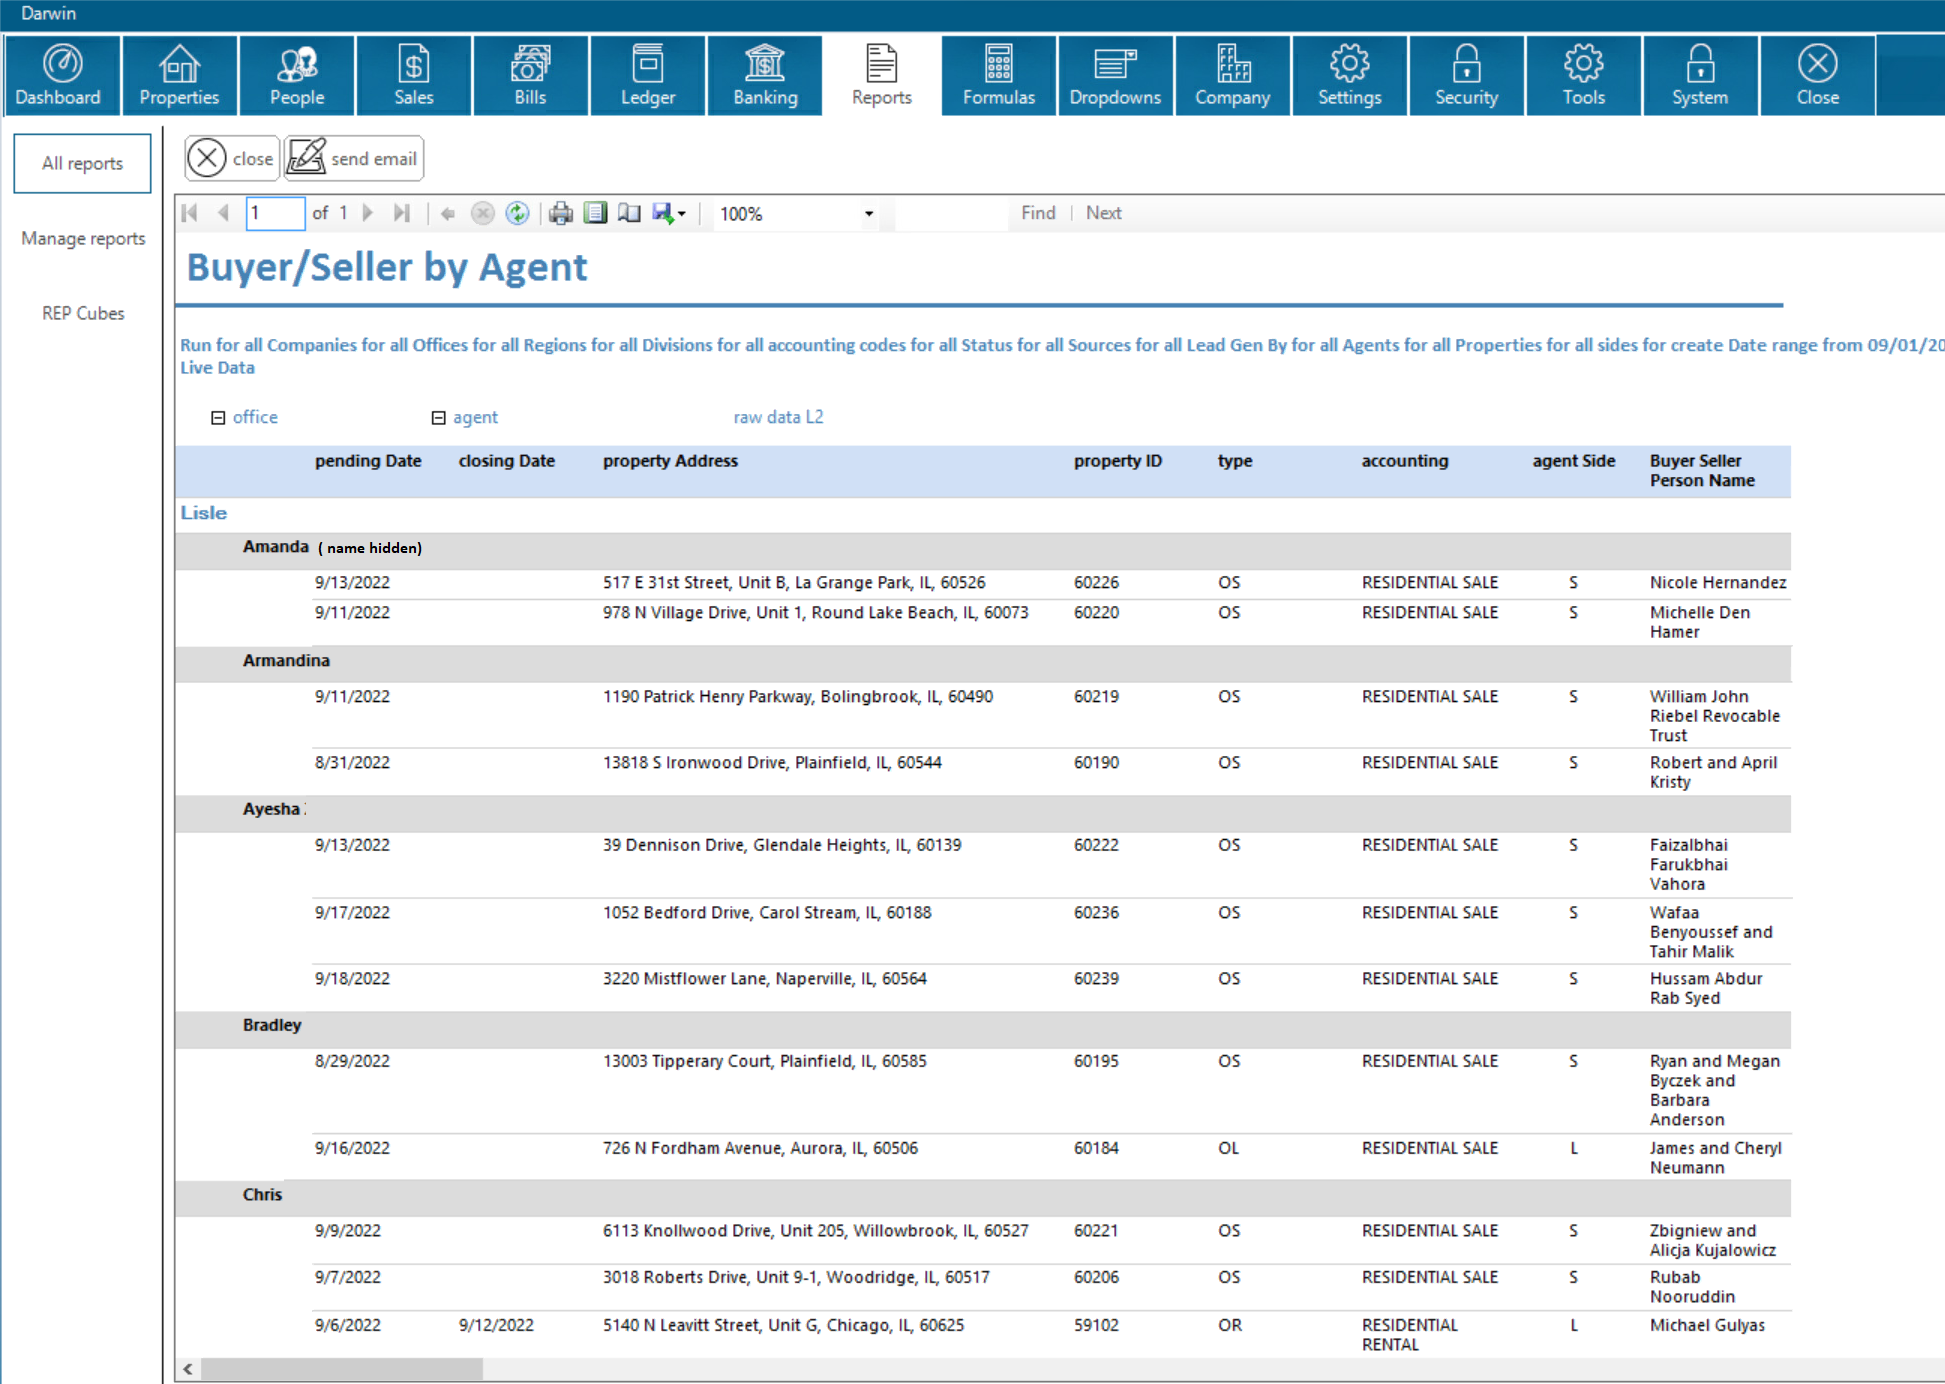
- buyer & seller grouped by agent in any given date range, see all the buyers & sellers arranged by the agent tht worked with the clients. sample
ready to evolve?
request a demo or learn more about the power of darwin.Cloud