
real estate brokerage reporting software that turns data into direction
Bring financial and productivity data together with detailed reports, live dashboards, projections, goals, and role-specific access—without relying on time-consuming spreadsheets.

timely information for every level of your brokerage
Whether your organization is growing or already operates multiple companies, darwin.Cloud puts accurate reports and projections at your fingertips. It reduces repetitive, expensive bookkeeping work so senior accounting staff can focus on higher-impact priorities. Interactive dashboards and reports can be tailored to specific roles and responsibilities, giving management the precise insights needed to make informed decisions and act on opportunities.
financial + production
review operational and accounting performance together.
live visibility
see current information from the home page or a mobile device.
role-specific views
shape access, reports, and dashboards around each person.
connected operations
connect reporting to the right operating model
darwin.Cloud reporting stays connected to brokerage accounting, commission, and production data. If you want the AccountTECH team to operate the accounting workflow that produces those results, review our accounting services for real estate brokerages.

analytic dashboards built around the decisions you make
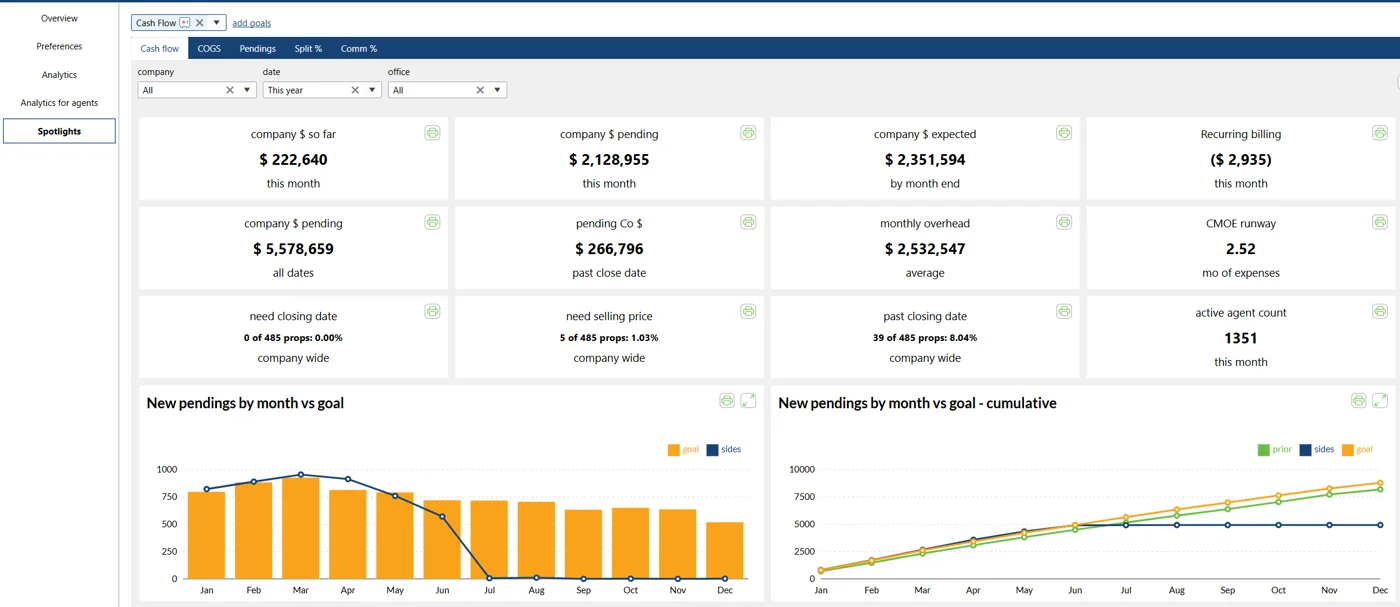
See your most important information from the darwin.Cloud home page or a mobile device in real time.
- customize dashboards from over 1,500 KPI analytics
- make different dashboards for different people in your company
- control access to sensitive information by company, office, or region
- change dashboards at any time with easy drag-and-drop tools
financial reporting your brokerage and CPA can rely on
Every accounting report your CPA needs is included in darwin.Cloud, from budget reports to year-over-year financials. Report structures adhere to generally accepted accounting principles, keeping results clear for your finance team. Filter and compare offices or companies side by side, then use analytic dashboards to view profit-and-loss trends over time.

- financial reporting for all your companies or franchises in one software package
- all GAAP reports by company, office, region, or division with interactive drill-down detail
- bank reconciliations and trial balance detail inquiry tools
- interactive dashboards for both financial and productivity analysis
- budgeting for both financial and productivity goals
accessible reporting with controlled information flow
Print reports, view them in darwin.Cloud, analyze live dashboards, or deliver them automatically through scheduled and on-demand email. Control which reports team members can access, what information each report includes, and which companies and offices are visible to each person.
print, download, or email reports on demand
schedule reports to be delivered automatically by email
customize reports for different audiences and set different access permissions
let staff and agents run the reports they need on demand in darwin.Cloud
use the API to download compiled data to your own analytics engine or report writer
answer the questions that move your brokerage forward
- choose which data fields to include in in-depth agent production reports
- compare agents and offices across your companies, or compare agents to themselves and their goals over time
- run reports by company, office, region, or division—or combine all companies for a global organizational snapshot
- save customized reports to build a personalized report library that can be shared across the company
- export and deliver reports in a wide variety of formats, or export the raw data
- set budgets and goals for expenses and production measures such as days on market, new listings, PPP, and volume
- run reports showing recruiter and manager productivity
- track how external partners such as mortgage and title companies are performing
compare over time
Measure current results against prior periods, budgets, and goals.
report at any level
Move from a global view to company, office, region, division, team, or agent detail.
brokerage reporting software FAQ
Direct answers for brokerage leaders and accounting teams evaluating darwin.Cloud reporting.
What is real estate brokerage reporting software?
Real estate brokerage reporting software connects financial results with transaction, office, team, and agent production data. It helps brokerage leaders review profitability, cash flow, budgets, goals, and operating performance without assembling separate spreadsheets.
What financial reports are available in darwin.Cloud?
darwin.Cloud includes brokerage financial reporting such as profit and loss, budget comparisons, cash-flow views, bank reconciliations, trial-balance detail, and multi-company reporting. Reports can be filtered by company, office, region, or division.
Can darwin.Cloud report on agent and office performance?
Yes. Brokerage teams can compare agent, office, team, and company performance, review production trends, measure results against goals, and combine financial and productivity data in role-specific dashboards and reports.
Can reports be customized and delivered automatically?
Yes. Teams can choose report fields, save customized report layouts, control which companies and offices each person can see, and deliver reports through scheduled or on-demand email. Reports can also be printed, downloaded, or exported.
Does darwin.Cloud support multi-company brokerage reporting?
Yes. darwin.Cloud can report by individual company, office, region, or division and can combine multiple companies into a consolidated organizational view while preserving role-based access to sensitive information.